Spaniard vs Immigrants from Cuba Currently Married
COMPARE
Spaniard
Immigrants from Cuba
Currently Married
Currently Married Comparison
Spaniards
Immigrants from Cuba
46.8%
CURRENTLY MARRIED
58.8/ 100
METRIC RATING
167th/ 347
METRIC RANK
43.7%
CURRENTLY MARRIED
0.1/ 100
METRIC RATING
263rd/ 347
METRIC RANK
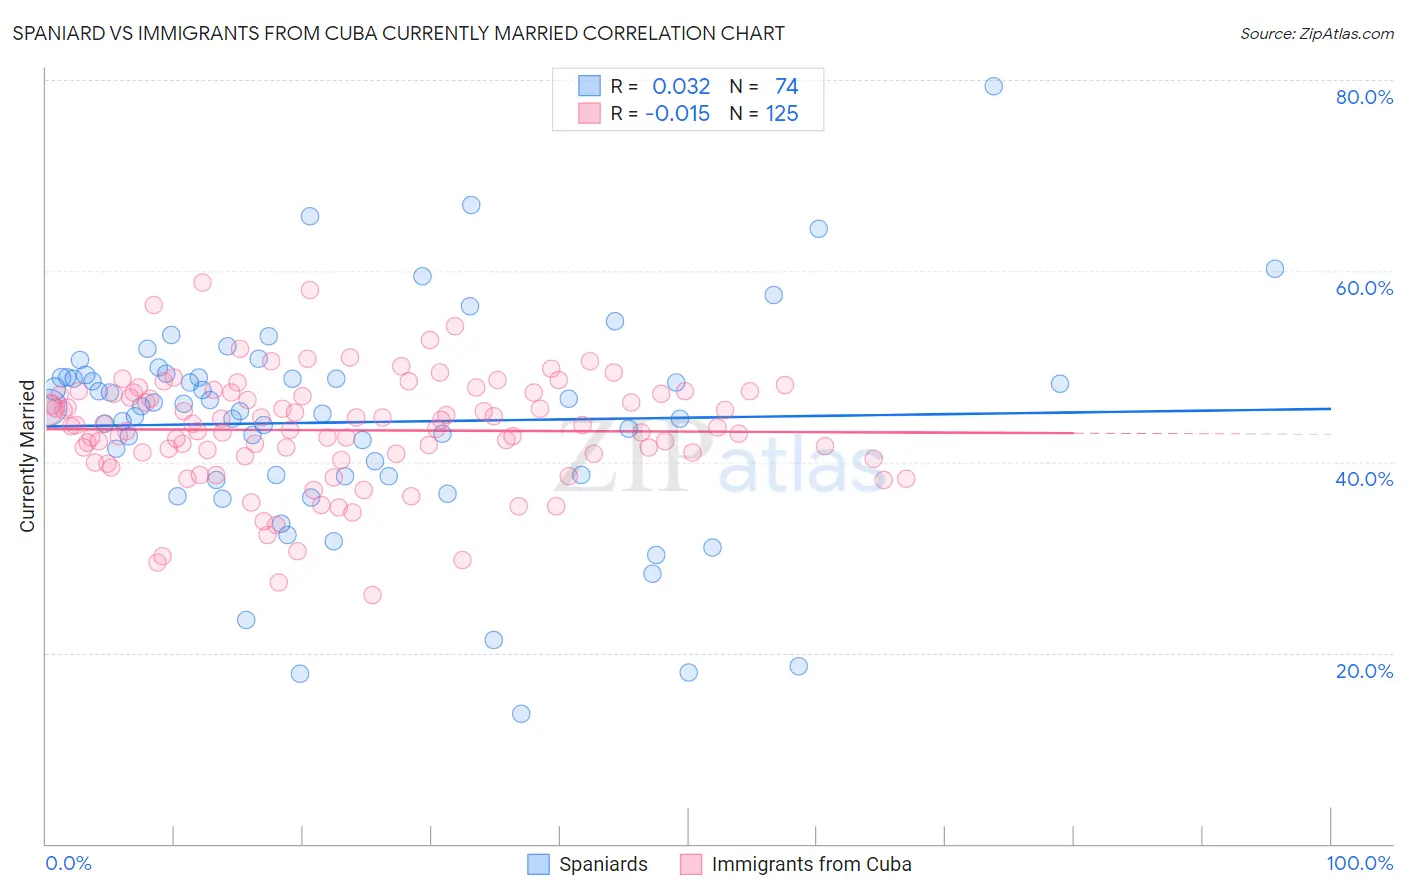
Spaniard vs Immigrants from Cuba Currently Married Correlation Chart
The statistical analysis conducted on geographies consisting of 443,497,994 people shows no correlation between the proportion of Spaniards and percentage of population currently married in the United States with a correlation coefficient (R) of 0.032 and weighted average of 46.8%. Similarly, the statistical analysis conducted on geographies consisting of 326,015,696 people shows no correlation between the proportion of Immigrants from Cuba and percentage of population currently married in the United States with a correlation coefficient (R) of -0.015 and weighted average of 43.7%, a difference of 7.1%.
Currently Married Correlation Summary
| Measurement | Spaniard | Immigrants from Cuba |
| Minimum | 13.6% | 26.1% |
| Maximum | 79.3% | 58.8% |
| Range | 65.7% | 32.7% |
| Mean | 44.1% | 43.3% |
| Median | 45.8% | 43.8% |
| Interquartile 25% (IQ1) | 38.5% | 40.7% |
| Interquartile 75% (IQ3) | 48.9% | 47.2% |
| Interquartile Range (IQR) | 10.3% | 6.5% |
| Standard Deviation (Sample) | 11.5% | 5.8% |
| Standard Deviation (Population) | 11.4% | 5.8% |
Similar Demographics by Currently Married
Demographics Similar to Spaniards by Currently Married
In terms of currently married, the demographic groups most similar to Spaniards are Immigrants from Syria (46.8%, a difference of 0.020%), Immigrants from Afghanistan (46.8%, a difference of 0.020%), Armenian (46.8%, a difference of 0.020%), Samoan (46.8%, a difference of 0.040%), and Immigrants from Latvia (46.7%, a difference of 0.080%).
| Demographics | Rating | Rank | Currently Married |
| Immigrants | Uzbekistan | 66.0 /100 | #160 | Good 46.9% |
| Immigrants | Southern Europe | 65.9 /100 | #161 | Good 46.9% |
| Immigrants | Nonimmigrants | 65.4 /100 | #162 | Good 46.9% |
| Delaware | 64.7 /100 | #163 | Good 46.9% |
| Immigrants | Western Asia | 64.2 /100 | #164 | Good 46.9% |
| Samoans | 59.8 /100 | #165 | Average 46.8% |
| Immigrants | Syria | 59.3 /100 | #166 | Average 46.8% |
| Spaniards | 58.8 /100 | #167 | Average 46.8% |
| Immigrants | Afghanistan | 58.2 /100 | #168 | Average 46.8% |
| Armenians | 58.2 /100 | #169 | Average 46.8% |
| Immigrants | Latvia | 56.7 /100 | #170 | Average 46.7% |
| Immigrants | Zimbabwe | 52.4 /100 | #171 | Average 46.7% |
| Aleuts | 52.0 /100 | #172 | Average 46.7% |
| Tlingit-Haida | 51.2 /100 | #173 | Average 46.7% |
| Peruvians | 50.0 /100 | #174 | Average 46.6% |
Demographics Similar to Immigrants from Cuba by Currently Married
In terms of currently married, the demographic groups most similar to Immigrants from Cuba are Sudanese (43.7%, a difference of 0.010%), Bangladeshi (43.7%, a difference of 0.040%), Immigrants from Bangladesh (43.6%, a difference of 0.10%), Ecuadorian (43.6%, a difference of 0.16%), and Immigrants from Nicaragua (43.7%, a difference of 0.18%).
| Demographics | Rating | Rank | Currently Married |
| Shoshone | 0.2 /100 | #256 | Tragic 44.0% |
| Immigrants | Africa | 0.2 /100 | #257 | Tragic 43.9% |
| Ute | 0.2 /100 | #258 | Tragic 43.9% |
| Immigrants | Sierra Leone | 0.1 /100 | #259 | Tragic 43.8% |
| Immigrants | Latin America | 0.1 /100 | #260 | Tragic 43.8% |
| Immigrants | Nicaragua | 0.1 /100 | #261 | Tragic 43.7% |
| Bangladeshis | 0.1 /100 | #262 | Tragic 43.7% |
| Immigrants | Cuba | 0.1 /100 | #263 | Tragic 43.7% |
| Sudanese | 0.1 /100 | #264 | Tragic 43.7% |
| Immigrants | Bangladesh | 0.1 /100 | #265 | Tragic 43.6% |
| Ecuadorians | 0.1 /100 | #266 | Tragic 43.6% |
| Immigrants | Eritrea | 0.1 /100 | #267 | Tragic 43.6% |
| Spanish American Indians | 0.1 /100 | #268 | Tragic 43.6% |
| Immigrants | Sudan | 0.1 /100 | #269 | Tragic 43.5% |
| Salvadorans | 0.1 /100 | #270 | Tragic 43.5% |