South American Indian vs Kiowa Unemployment
COMPARE
South American Indian
Kiowa
Unemployment
Unemployment Comparison
South American Indians
Kiowa
5.5%
UNEMPLOYMENT
7.8/ 100
METRIC RATING
225th/ 347
METRIC RANK
5.7%
UNEMPLOYMENT
0.6/ 100
METRIC RATING
251st/ 347
METRIC RANK
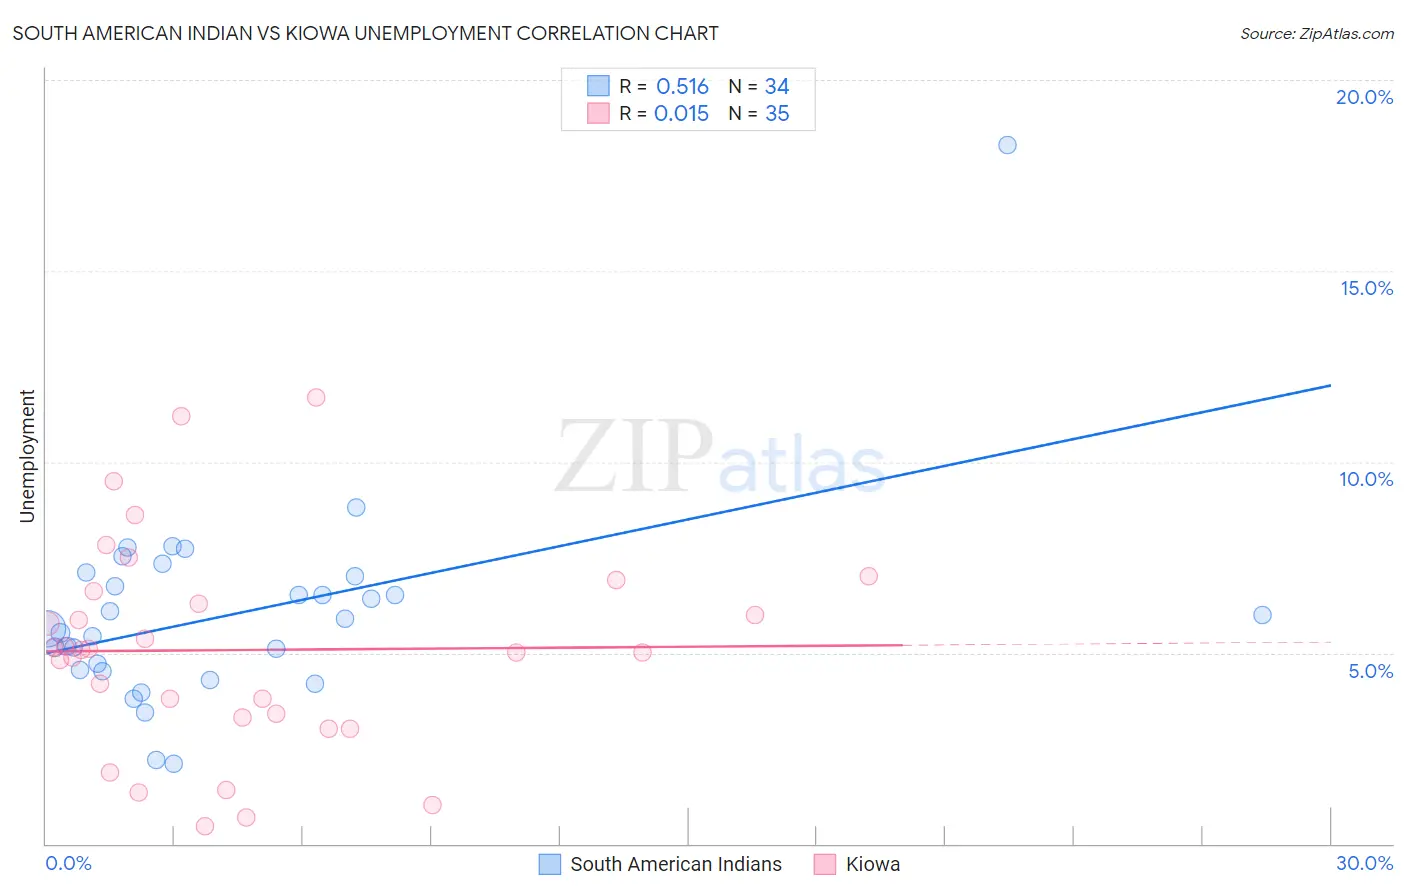
South American Indian vs Kiowa Unemployment Correlation Chart
The statistical analysis conducted on geographies consisting of 164,508,127 people shows a substantial positive correlation between the proportion of South American Indians and unemployment in the United States with a correlation coefficient (R) of 0.516 and weighted average of 5.5%. Similarly, the statistical analysis conducted on geographies consisting of 56,085,771 people shows no correlation between the proportion of Kiowa and unemployment in the United States with a correlation coefficient (R) of 0.015 and weighted average of 5.7%, a difference of 4.0%.
Unemployment Correlation Summary
| Measurement | South American Indian | Kiowa |
| Minimum | 2.1% | 0.44% |
| Maximum | 18.3% | 11.7% |
| Range | 16.2% | 11.3% |
| Mean | 6.0% | 5.1% |
| Median | 5.8% | 5.1% |
| Interquartile 25% (IQ1) | 4.5% | 3.3% |
| Interquartile 75% (IQ3) | 7.0% | 6.6% |
| Interquartile Range (IQR) | 2.5% | 3.3% |
| Standard Deviation (Sample) | 2.7% | 2.7% |
| Standard Deviation (Population) | 2.6% | 2.7% |
Similar Demographics by Unemployment
Demographics Similar to South American Indians by Unemployment
In terms of unemployment, the demographic groups most similar to South American Indians are Samoan (5.5%, a difference of 0.15%), Immigrants from Lebanon (5.5%, a difference of 0.18%), Israeli (5.4%, a difference of 0.20%), Seminole (5.4%, a difference of 0.27%), and Guamanian/Chamorro (5.5%, a difference of 0.33%).
| Demographics | Rating | Rank | Unemployment |
| Choctaw | 12.7 /100 | #218 | Poor 5.4% |
| Bangladeshis | 11.2 /100 | #219 | Poor 5.4% |
| Soviet Union | 10.6 /100 | #220 | Poor 5.4% |
| Immigrants | Philippines | 10.4 /100 | #221 | Poor 5.4% |
| Iroquois | 10.3 /100 | #222 | Poor 5.4% |
| Seminole | 9.2 /100 | #223 | Tragic 5.4% |
| Israelis | 8.8 /100 | #224 | Tragic 5.4% |
| South American Indians | 7.8 /100 | #225 | Tragic 5.5% |
| Samoans | 7.1 /100 | #226 | Tragic 5.5% |
| Immigrants | Lebanon | 7.0 /100 | #227 | Tragic 5.5% |
| Guamanians/Chamorros | 6.3 /100 | #228 | Tragic 5.5% |
| Hawaiians | 5.4 /100 | #229 | Tragic 5.5% |
| Ottawa | 5.4 /100 | #230 | Tragic 5.5% |
| Immigrants | Africa | 4.9 /100 | #231 | Tragic 5.5% |
| Comanche | 4.9 /100 | #232 | Tragic 5.5% |
Demographics Similar to Kiowa by Unemployment
In terms of unemployment, the demographic groups most similar to Kiowa are Japanese (5.6%, a difference of 0.47%), Cajun (5.6%, a difference of 0.48%), Liberian (5.6%, a difference of 0.74%), Honduran (5.7%, a difference of 0.74%), and Central American (5.7%, a difference of 0.75%).
| Demographics | Rating | Rank | Unemployment |
| Dutch West Indians | 1.2 /100 | #244 | Tragic 5.6% |
| French American Indians | 1.2 /100 | #245 | Tragic 5.6% |
| Bermudans | 1.1 /100 | #246 | Tragic 5.6% |
| Immigrants | Cameroon | 1.0 /100 | #247 | Tragic 5.6% |
| Liberians | 0.9 /100 | #248 | Tragic 5.6% |
| Cajuns | 0.8 /100 | #249 | Tragic 5.6% |
| Japanese | 0.8 /100 | #250 | Tragic 5.6% |
| Kiowa | 0.6 /100 | #251 | Tragic 5.7% |
| Hondurans | 0.3 /100 | #252 | Tragic 5.7% |
| Central Americans | 0.3 /100 | #253 | Tragic 5.7% |
| Immigrants | Honduras | 0.3 /100 | #254 | Tragic 5.7% |
| Immigrants | Portugal | 0.2 /100 | #255 | Tragic 5.7% |
| Guatemalans | 0.2 /100 | #256 | Tragic 5.8% |
| Yaqui | 0.2 /100 | #257 | Tragic 5.8% |
| Immigrants | Bahamas | 0.1 /100 | #258 | Tragic 5.8% |