South American Indian vs Jordanian Unemployment
COMPARE
South American Indian
Jordanian
Unemployment
Unemployment Comparison
South American Indians
Jordanians
5.5%
UNEMPLOYMENT
7.8/ 100
METRIC RATING
225th/ 347
METRIC RANK
5.0%
UNEMPLOYMENT
96.4/ 100
METRIC RATING
89th/ 347
METRIC RANK
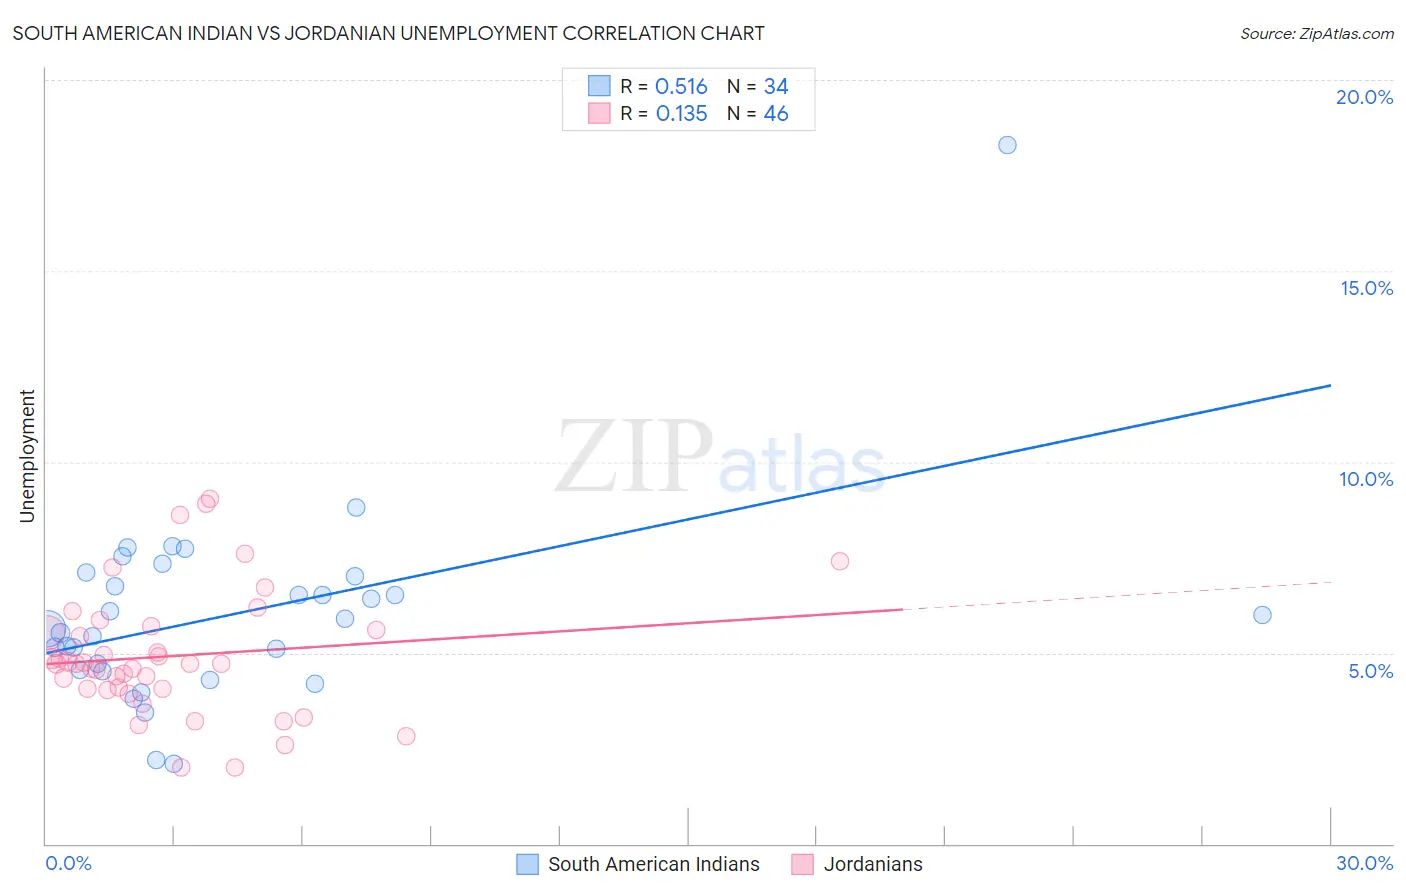
South American Indian vs Jordanian Unemployment Correlation Chart
The statistical analysis conducted on geographies consisting of 164,508,127 people shows a substantial positive correlation between the proportion of South American Indians and unemployment in the United States with a correlation coefficient (R) of 0.516 and weighted average of 5.5%. Similarly, the statistical analysis conducted on geographies consisting of 166,387,098 people shows a poor positive correlation between the proportion of Jordanians and unemployment in the United States with a correlation coefficient (R) of 0.135 and weighted average of 5.0%, a difference of 9.3%.
Unemployment Correlation Summary
| Measurement | South American Indian | Jordanian |
| Minimum | 2.1% | 2.0% |
| Maximum | 18.3% | 9.0% |
| Range | 16.2% | 7.0% |
| Mean | 6.0% | 4.9% |
| Median | 5.8% | 4.7% |
| Interquartile 25% (IQ1) | 4.5% | 4.1% |
| Interquartile 75% (IQ3) | 7.0% | 5.6% |
| Interquartile Range (IQR) | 2.5% | 1.5% |
| Standard Deviation (Sample) | 2.7% | 1.6% |
| Standard Deviation (Population) | 2.6% | 1.6% |
Similar Demographics by Unemployment
Demographics Similar to South American Indians by Unemployment
In terms of unemployment, the demographic groups most similar to South American Indians are Samoan (5.5%, a difference of 0.15%), Immigrants from Lebanon (5.5%, a difference of 0.18%), Israeli (5.4%, a difference of 0.20%), Seminole (5.4%, a difference of 0.27%), and Guamanian/Chamorro (5.5%, a difference of 0.33%).
| Demographics | Rating | Rank | Unemployment |
| Choctaw | 12.7 /100 | #218 | Poor 5.4% |
| Bangladeshis | 11.2 /100 | #219 | Poor 5.4% |
| Soviet Union | 10.6 /100 | #220 | Poor 5.4% |
| Immigrants | Philippines | 10.4 /100 | #221 | Poor 5.4% |
| Iroquois | 10.3 /100 | #222 | Poor 5.4% |
| Seminole | 9.2 /100 | #223 | Tragic 5.4% |
| Israelis | 8.8 /100 | #224 | Tragic 5.4% |
| South American Indians | 7.8 /100 | #225 | Tragic 5.5% |
| Samoans | 7.1 /100 | #226 | Tragic 5.5% |
| Immigrants | Lebanon | 7.0 /100 | #227 | Tragic 5.5% |
| Guamanians/Chamorros | 6.3 /100 | #228 | Tragic 5.5% |
| Hawaiians | 5.4 /100 | #229 | Tragic 5.5% |
| Ottawa | 5.4 /100 | #230 | Tragic 5.5% |
| Immigrants | Africa | 4.9 /100 | #231 | Tragic 5.5% |
| Comanche | 4.9 /100 | #232 | Tragic 5.5% |
Demographics Similar to Jordanians by Unemployment
In terms of unemployment, the demographic groups most similar to Jordanians are Immigrants from North Macedonia (5.0%, a difference of 0.040%), Immigrants from Sudan (5.0%, a difference of 0.050%), Immigrants from South Africa (5.0%, a difference of 0.070%), Immigrants from Korea (5.0%, a difference of 0.090%), and Immigrants from Moldova (5.0%, a difference of 0.12%).
| Demographics | Rating | Rank | Unemployment |
| Fijians | 97.6 /100 | #82 | Exceptional 5.0% |
| Hmong | 97.6 /100 | #83 | Exceptional 5.0% |
| Russians | 97.4 /100 | #84 | Exceptional 5.0% |
| Immigrants | Australia | 97.0 /100 | #85 | Exceptional 5.0% |
| Hungarians | 96.9 /100 | #86 | Exceptional 5.0% |
| Immigrants | Moldova | 96.6 /100 | #87 | Exceptional 5.0% |
| Immigrants | Korea | 96.6 /100 | #88 | Exceptional 5.0% |
| Jordanians | 96.4 /100 | #89 | Exceptional 5.0% |
| Immigrants | North Macedonia | 96.3 /100 | #90 | Exceptional 5.0% |
| Immigrants | Sudan | 96.3 /100 | #91 | Exceptional 5.0% |
| Immigrants | South Africa | 96.2 /100 | #92 | Exceptional 5.0% |
| Ukrainians | 96.0 /100 | #93 | Exceptional 5.0% |
| Immigrants | Austria | 95.9 /100 | #94 | Exceptional 5.0% |
| Immigrants | Serbia | 95.6 /100 | #95 | Exceptional 5.0% |
| Immigrants | England | 95.2 /100 | #96 | Exceptional 5.0% |