South American Indian vs Immigrants from Micronesia Unemployment
COMPARE
South American Indian
Immigrants from Micronesia
Unemployment
Unemployment Comparison
South American Indians
Immigrants from Micronesia
5.5%
UNEMPLOYMENT
7.8/ 100
METRIC RATING
225th/ 347
METRIC RANK
5.3%
UNEMPLOYMENT
25.2/ 100
METRIC RATING
203rd/ 347
METRIC RANK
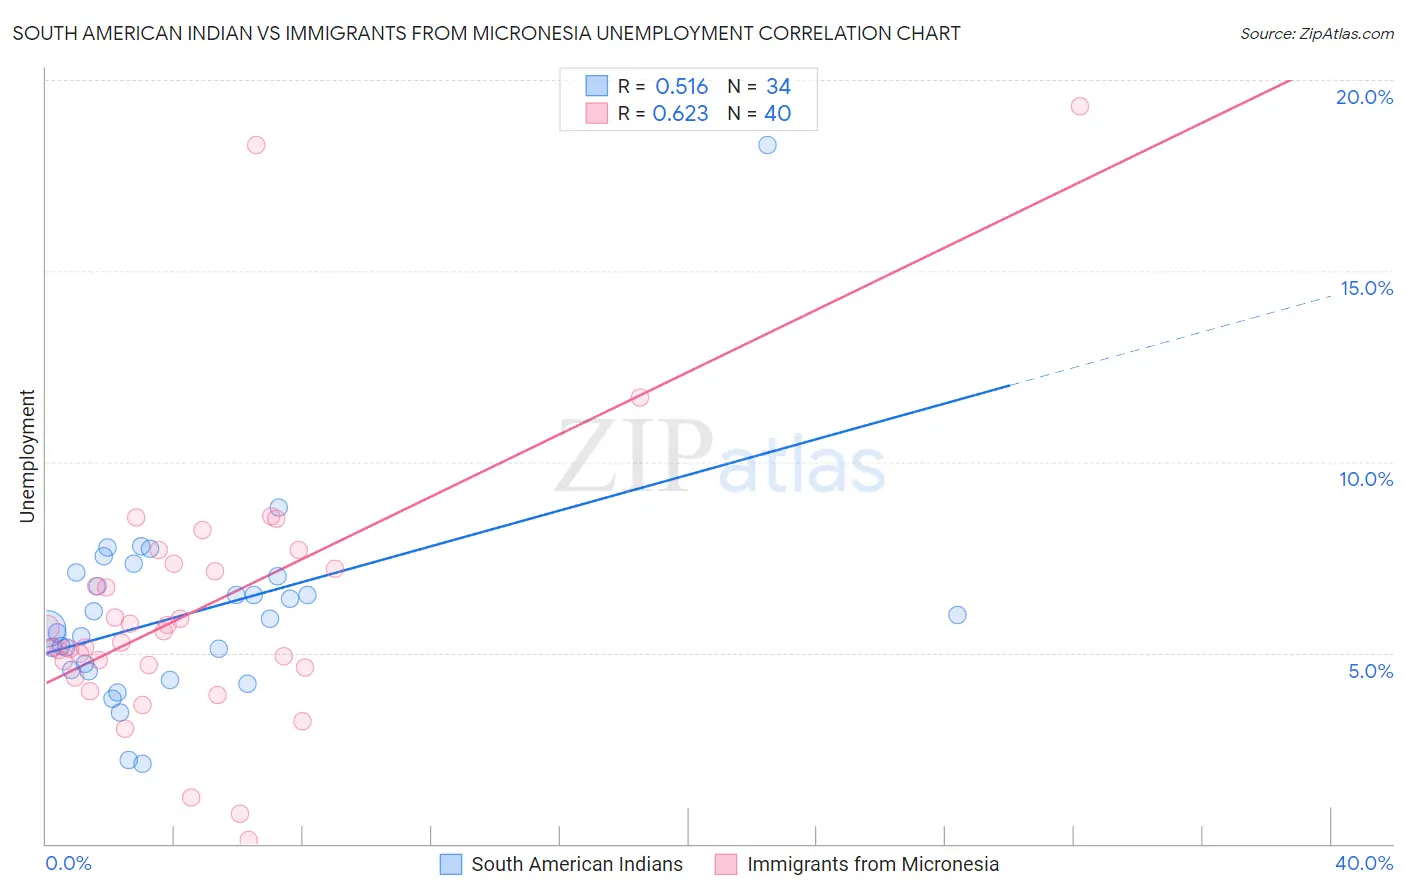
South American Indian vs Immigrants from Micronesia Unemployment Correlation Chart
The statistical analysis conducted on geographies consisting of 164,508,127 people shows a substantial positive correlation between the proportion of South American Indians and unemployment in the United States with a correlation coefficient (R) of 0.516 and weighted average of 5.5%. Similarly, the statistical analysis conducted on geographies consisting of 61,596,499 people shows a significant positive correlation between the proportion of Immigrants from Micronesia and unemployment in the United States with a correlation coefficient (R) of 0.623 and weighted average of 5.3%, a difference of 2.1%.
Unemployment Correlation Summary
| Measurement | South American Indian | Immigrants from Micronesia |
| Minimum | 2.1% | 0.10% |
| Maximum | 18.3% | 19.3% |
| Range | 16.2% | 19.2% |
| Mean | 6.0% | 6.2% |
| Median | 5.8% | 5.4% |
| Interquartile 25% (IQ1) | 4.5% | 4.6% |
| Interquartile 75% (IQ3) | 7.0% | 7.3% |
| Interquartile Range (IQR) | 2.5% | 2.6% |
| Standard Deviation (Sample) | 2.7% | 3.7% |
| Standard Deviation (Population) | 2.6% | 3.6% |
Similar Demographics by Unemployment
Demographics Similar to South American Indians by Unemployment
In terms of unemployment, the demographic groups most similar to South American Indians are Samoan (5.5%, a difference of 0.15%), Immigrants from Lebanon (5.5%, a difference of 0.18%), Israeli (5.4%, a difference of 0.20%), Seminole (5.4%, a difference of 0.27%), and Guamanian/Chamorro (5.5%, a difference of 0.33%).
| Demographics | Rating | Rank | Unemployment |
| Choctaw | 12.7 /100 | #218 | Poor 5.4% |
| Bangladeshis | 11.2 /100 | #219 | Poor 5.4% |
| Soviet Union | 10.6 /100 | #220 | Poor 5.4% |
| Immigrants | Philippines | 10.4 /100 | #221 | Poor 5.4% |
| Iroquois | 10.3 /100 | #222 | Poor 5.4% |
| Seminole | 9.2 /100 | #223 | Tragic 5.4% |
| Israelis | 8.8 /100 | #224 | Tragic 5.4% |
| South American Indians | 7.8 /100 | #225 | Tragic 5.5% |
| Samoans | 7.1 /100 | #226 | Tragic 5.5% |
| Immigrants | Lebanon | 7.0 /100 | #227 | Tragic 5.5% |
| Guamanians/Chamorros | 6.3 /100 | #228 | Tragic 5.5% |
| Hawaiians | 5.4 /100 | #229 | Tragic 5.5% |
| Ottawa | 5.4 /100 | #230 | Tragic 5.5% |
| Immigrants | Africa | 4.9 /100 | #231 | Tragic 5.5% |
| Comanche | 4.9 /100 | #232 | Tragic 5.5% |
Demographics Similar to Immigrants from Micronesia by Unemployment
In terms of unemployment, the demographic groups most similar to Immigrants from Micronesia are Cherokee (5.3%, a difference of 0.030%), Immigrants from Ukraine (5.3%, a difference of 0.030%), Native Hawaiian (5.3%, a difference of 0.080%), Immigrants from South Eastern Asia (5.3%, a difference of 0.14%), and Korean (5.3%, a difference of 0.17%).
| Demographics | Rating | Rank | Unemployment |
| Peruvians | 29.9 /100 | #196 | Fair 5.3% |
| Immigrants | Uruguay | 29.8 /100 | #197 | Fair 5.3% |
| Immigrants | Israel | 28.6 /100 | #198 | Fair 5.3% |
| Immigrants | Afghanistan | 28.6 /100 | #199 | Fair 5.3% |
| Koreans | 27.4 /100 | #200 | Fair 5.3% |
| Immigrants | South Eastern Asia | 27.0 /100 | #201 | Fair 5.3% |
| Cherokee | 25.5 /100 | #202 | Fair 5.3% |
| Immigrants | Micronesia | 25.2 /100 | #203 | Fair 5.3% |
| Immigrants | Ukraine | 24.9 /100 | #204 | Fair 5.3% |
| Native Hawaiians | 24.1 /100 | #205 | Fair 5.3% |
| Immigrants | Peru | 22.7 /100 | #206 | Fair 5.4% |
| Creek | 19.4 /100 | #207 | Poor 5.4% |
| Portuguese | 19.0 /100 | #208 | Poor 5.4% |
| Immigrants | Iran | 18.8 /100 | #209 | Poor 5.4% |
| Immigrants | Iraq | 18.6 /100 | #210 | Poor 5.4% |