South American Indian vs Kiowa Cognitive Disability
COMPARE
South American Indian
Kiowa
Cognitive Disability
Cognitive Disability Comparison
South American Indians
Kiowa
17.5%
COGNITIVE DISABILITY
13.0/ 100
METRIC RATING
201st/ 347
METRIC RANK
18.7%
COGNITIVE DISABILITY
0.0/ 100
METRIC RATING
328th/ 347
METRIC RANK
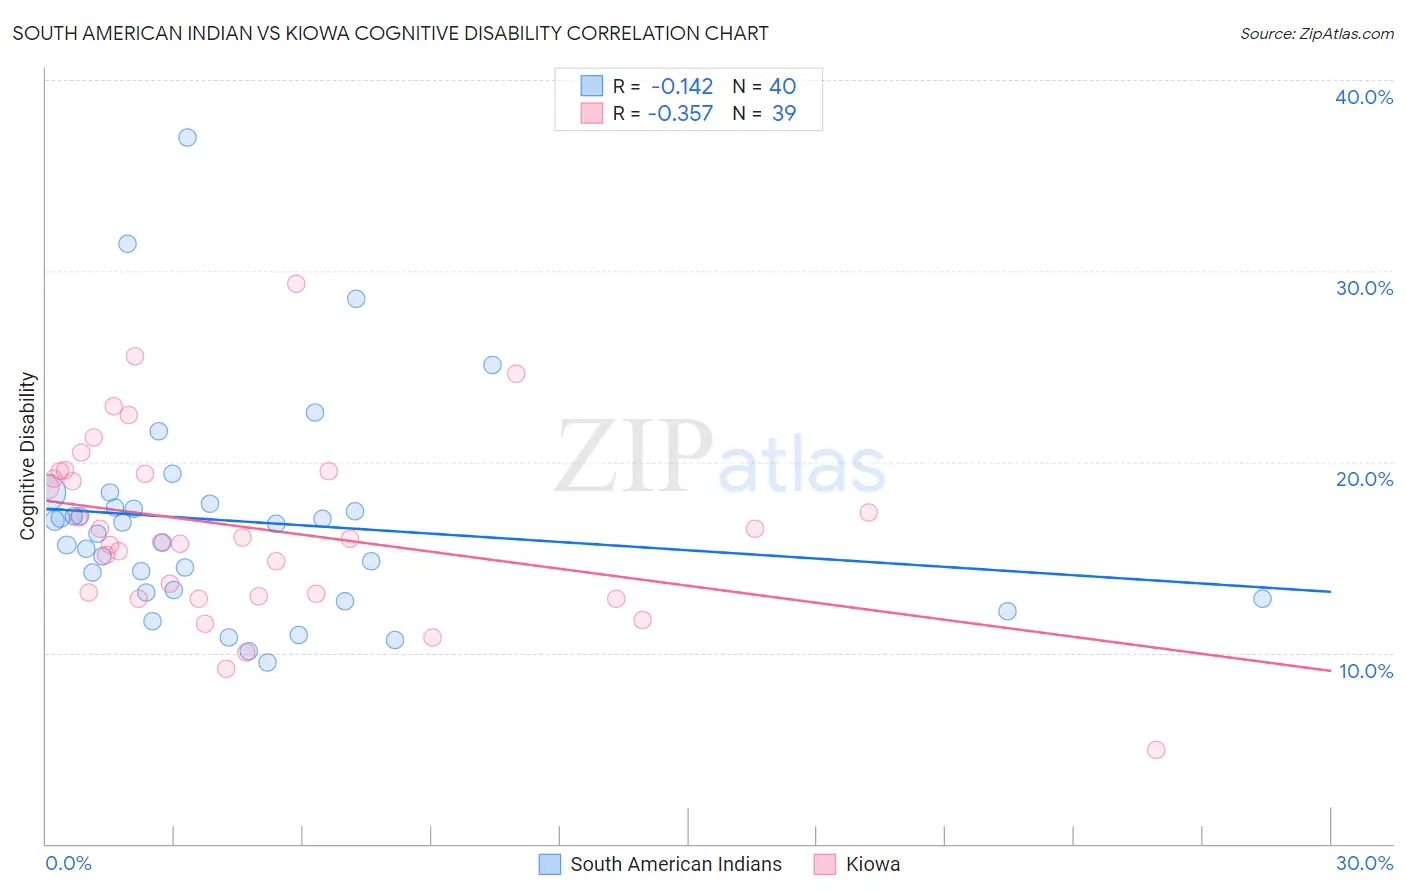
South American Indian vs Kiowa Cognitive Disability Correlation Chart
The statistical analysis conducted on geographies consisting of 164,561,639 people shows a poor negative correlation between the proportion of South American Indians and percentage of population with cognitive disability in the United States with a correlation coefficient (R) of -0.142 and weighted average of 17.5%. Similarly, the statistical analysis conducted on geographies consisting of 56,098,824 people shows a mild negative correlation between the proportion of Kiowa and percentage of population with cognitive disability in the United States with a correlation coefficient (R) of -0.357 and weighted average of 18.7%, a difference of 6.9%.
Cognitive Disability Correlation Summary
| Measurement | South American Indian | Kiowa |
| Minimum | 9.5% | 4.9% |
| Maximum | 37.0% | 29.3% |
| Range | 27.5% | 24.4% |
| Mean | 16.9% | 16.5% |
| Median | 16.5% | 16.0% |
| Interquartile 25% (IQ1) | 13.3% | 12.9% |
| Interquartile 75% (IQ3) | 17.7% | 19.5% |
| Interquartile Range (IQR) | 4.5% | 6.6% |
| Standard Deviation (Sample) | 5.6% | 4.8% |
| Standard Deviation (Population) | 5.6% | 4.8% |
Similar Demographics by Cognitive Disability
Demographics Similar to South American Indians by Cognitive Disability
In terms of cognitive disability, the demographic groups most similar to South American Indians are Immigrants from Morocco (17.5%, a difference of 0.060%), Haitian (17.5%, a difference of 0.070%), Immigrants from Singapore (17.5%, a difference of 0.080%), Immigrants from Panama (17.5%, a difference of 0.11%), and Immigrants from Caribbean (17.5%, a difference of 0.13%).
| Demographics | Rating | Rank | Cognitive Disability |
| Immigrants | Bosnia and Herzegovina | 22.0 /100 | #194 | Fair 17.4% |
| New Zealanders | 21.1 /100 | #195 | Fair 17.4% |
| Guyanese | 17.5 /100 | #196 | Poor 17.5% |
| Immigrants | Afghanistan | 16.7 /100 | #197 | Poor 17.5% |
| Immigrants | Panama | 14.8 /100 | #198 | Poor 17.5% |
| Immigrants | Singapore | 14.3 /100 | #199 | Poor 17.5% |
| Haitians | 14.1 /100 | #200 | Poor 17.5% |
| South American Indians | 13.0 /100 | #201 | Poor 17.5% |
| Immigrants | Morocco | 12.0 /100 | #202 | Poor 17.5% |
| Immigrants | Caribbean | 11.0 /100 | #203 | Poor 17.5% |
| Immigrants | Zimbabwe | 11.0 /100 | #204 | Poor 17.5% |
| Puget Sound Salish | 10.9 /100 | #205 | Poor 17.5% |
| Alaska Natives | 10.4 /100 | #206 | Poor 17.5% |
| Immigrants | Latin America | 9.7 /100 | #207 | Tragic 17.6% |
| Immigrants | Cameroon | 9.3 /100 | #208 | Tragic 17.6% |
Demographics Similar to Kiowa by Cognitive Disability
In terms of cognitive disability, the demographic groups most similar to Kiowa are U.S. Virgin Islander (18.7%, a difference of 0.060%), Immigrants from Senegal (18.7%, a difference of 0.10%), Indonesian (18.7%, a difference of 0.12%), Dominican (18.7%, a difference of 0.20%), and Navajo (18.8%, a difference of 0.22%).
| Demographics | Rating | Rank | Cognitive Disability |
| Africans | 0.0 /100 | #321 | Tragic 18.6% |
| Immigrants | Liberia | 0.0 /100 | #322 | Tragic 18.7% |
| Pueblo | 0.0 /100 | #323 | Tragic 18.7% |
| Dominicans | 0.0 /100 | #324 | Tragic 18.7% |
| Indonesians | 0.0 /100 | #325 | Tragic 18.7% |
| Immigrants | Senegal | 0.0 /100 | #326 | Tragic 18.7% |
| U.S. Virgin Islanders | 0.0 /100 | #327 | Tragic 18.7% |
| Kiowa | 0.0 /100 | #328 | Tragic 18.7% |
| Navajo | 0.0 /100 | #329 | Tragic 18.8% |
| Immigrants | Dominican Republic | 0.0 /100 | #330 | Tragic 18.8% |
| Pima | 0.0 /100 | #331 | Tragic 18.8% |
| Immigrants | Sudan | 0.0 /100 | #332 | Tragic 18.8% |
| Immigrants | Yemen | 0.0 /100 | #333 | Tragic 18.8% |
| Sudanese | 0.0 /100 | #334 | Tragic 18.9% |
| Senegalese | 0.0 /100 | #335 | Tragic 19.0% |