Immigrants from Romania vs Kiowa Unemployment
COMPARE
Immigrants from Romania
Kiowa
Unemployment
Unemployment Comparison
Immigrants from Romania
Kiowa
5.0%
UNEMPLOYMENT
93.7/ 100
METRIC RATING
106th/ 347
METRIC RANK
5.7%
UNEMPLOYMENT
0.6/ 100
METRIC RATING
251st/ 347
METRIC RANK
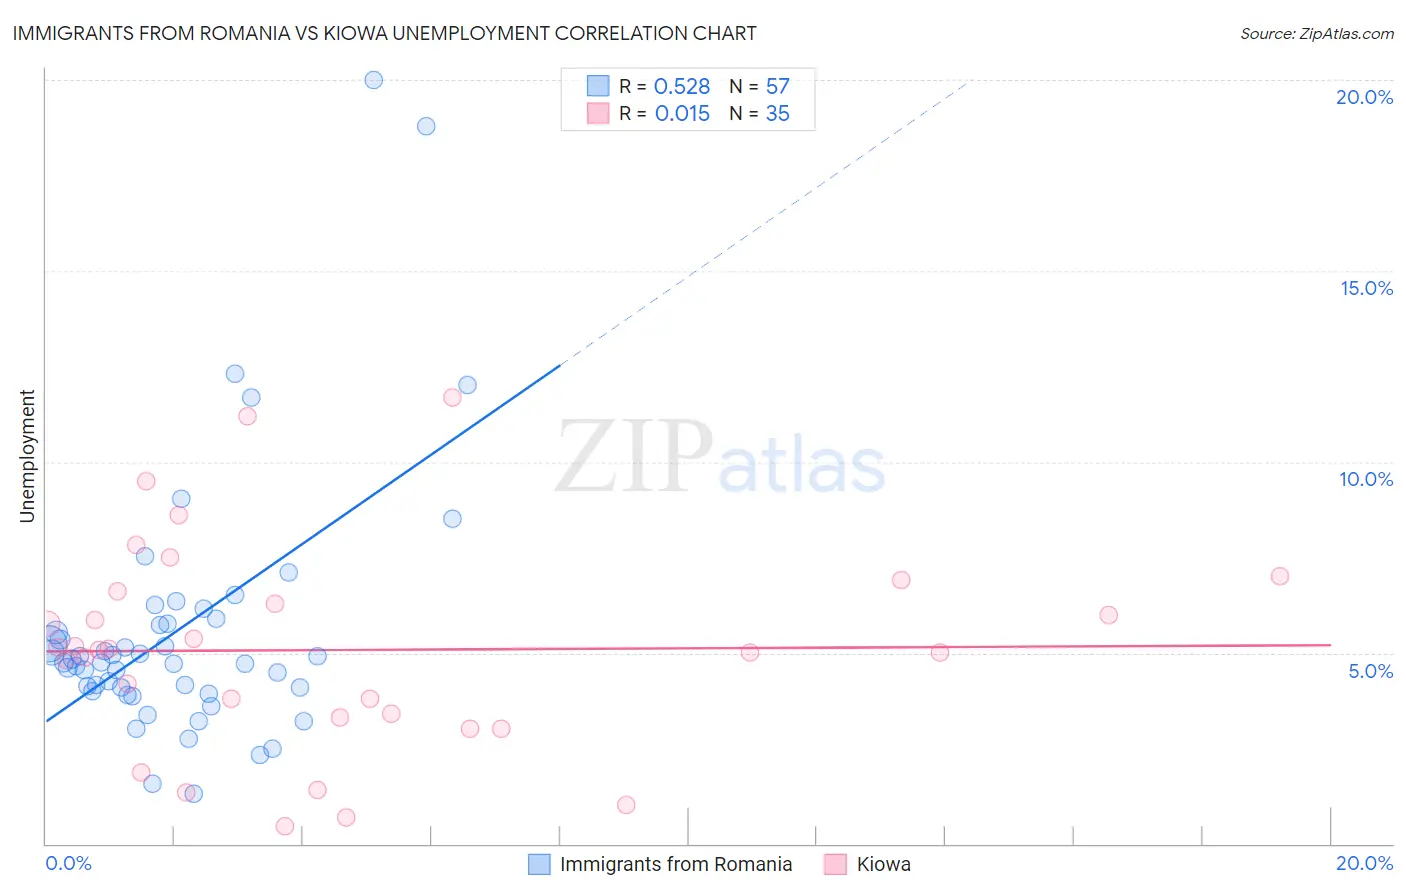
Immigrants from Romania vs Kiowa Unemployment Correlation Chart
The statistical analysis conducted on geographies consisting of 256,924,519 people shows a substantial positive correlation between the proportion of Immigrants from Romania and unemployment in the United States with a correlation coefficient (R) of 0.528 and weighted average of 5.0%. Similarly, the statistical analysis conducted on geographies consisting of 56,085,771 people shows no correlation between the proportion of Kiowa and unemployment in the United States with a correlation coefficient (R) of 0.015 and weighted average of 5.7%, a difference of 12.6%.
Unemployment Correlation Summary
| Measurement | Immigrants from Romania | Kiowa |
| Minimum | 1.3% | 0.44% |
| Maximum | 20.0% | 11.7% |
| Range | 18.7% | 11.3% |
| Mean | 5.6% | 5.1% |
| Median | 4.8% | 5.1% |
| Interquartile 25% (IQ1) | 4.0% | 3.3% |
| Interquartile 75% (IQ3) | 5.8% | 6.6% |
| Interquartile Range (IQR) | 1.8% | 3.3% |
| Standard Deviation (Sample) | 3.4% | 2.7% |
| Standard Deviation (Population) | 3.4% | 2.7% |
Similar Demographics by Unemployment
Demographics Similar to Immigrants from Romania by Unemployment
In terms of unemployment, the demographic groups most similar to Immigrants from Romania are Immigrants from Turkey (5.0%, a difference of 0.010%), Immigrants from Kuwait (5.0%, a difference of 0.020%), Chickasaw (5.0%, a difference of 0.070%), Osage (5.0%, a difference of 0.070%), and Maltese (5.0%, a difference of 0.070%).
| Demographics | Rating | Rank | Unemployment |
| Mongolians | 94.8 /100 | #99 | Exceptional 5.0% |
| Estonians | 94.6 /100 | #100 | Exceptional 5.0% |
| Americans | 94.3 /100 | #101 | Exceptional 5.0% |
| Immigrants | Argentina | 94.1 /100 | #102 | Exceptional 5.0% |
| Chickasaw | 94.0 /100 | #103 | Exceptional 5.0% |
| Osage | 94.0 /100 | #104 | Exceptional 5.0% |
| Maltese | 94.0 /100 | #105 | Exceptional 5.0% |
| Immigrants | Romania | 93.7 /100 | #106 | Exceptional 5.0% |
| Immigrants | Turkey | 93.7 /100 | #107 | Exceptional 5.0% |
| Immigrants | Kuwait | 93.7 /100 | #108 | Exceptional 5.0% |
| Immigrants | Eritrea | 93.3 /100 | #109 | Exceptional 5.0% |
| Immigrants | Lithuania | 93.2 /100 | #110 | Exceptional 5.0% |
| Chileans | 93.2 /100 | #111 | Exceptional 5.0% |
| South Africans | 92.6 /100 | #112 | Exceptional 5.1% |
| Argentineans | 92.4 /100 | #113 | Exceptional 5.1% |
Demographics Similar to Kiowa by Unemployment
In terms of unemployment, the demographic groups most similar to Kiowa are Japanese (5.6%, a difference of 0.47%), Cajun (5.6%, a difference of 0.48%), Liberian (5.6%, a difference of 0.74%), Honduran (5.7%, a difference of 0.74%), and Central American (5.7%, a difference of 0.75%).
| Demographics | Rating | Rank | Unemployment |
| Dutch West Indians | 1.2 /100 | #244 | Tragic 5.6% |
| French American Indians | 1.2 /100 | #245 | Tragic 5.6% |
| Bermudans | 1.1 /100 | #246 | Tragic 5.6% |
| Immigrants | Cameroon | 1.0 /100 | #247 | Tragic 5.6% |
| Liberians | 0.9 /100 | #248 | Tragic 5.6% |
| Cajuns | 0.8 /100 | #249 | Tragic 5.6% |
| Japanese | 0.8 /100 | #250 | Tragic 5.6% |
| Kiowa | 0.6 /100 | #251 | Tragic 5.7% |
| Hondurans | 0.3 /100 | #252 | Tragic 5.7% |
| Central Americans | 0.3 /100 | #253 | Tragic 5.7% |
| Immigrants | Honduras | 0.3 /100 | #254 | Tragic 5.7% |
| Immigrants | Portugal | 0.2 /100 | #255 | Tragic 5.7% |
| Guatemalans | 0.2 /100 | #256 | Tragic 5.8% |
| Yaqui | 0.2 /100 | #257 | Tragic 5.8% |
| Immigrants | Bahamas | 0.1 /100 | #258 | Tragic 5.8% |