South American Indian vs Immigrants from Central America Unemployment
COMPARE
South American Indian
Immigrants from Central America
Unemployment
Unemployment Comparison
South American Indians
Immigrants from Central America
5.5%
UNEMPLOYMENT
7.8/ 100
METRIC RATING
225th/ 347
METRIC RANK
6.0%
UNEMPLOYMENT
0.0/ 100
METRIC RATING
276th/ 347
METRIC RANK
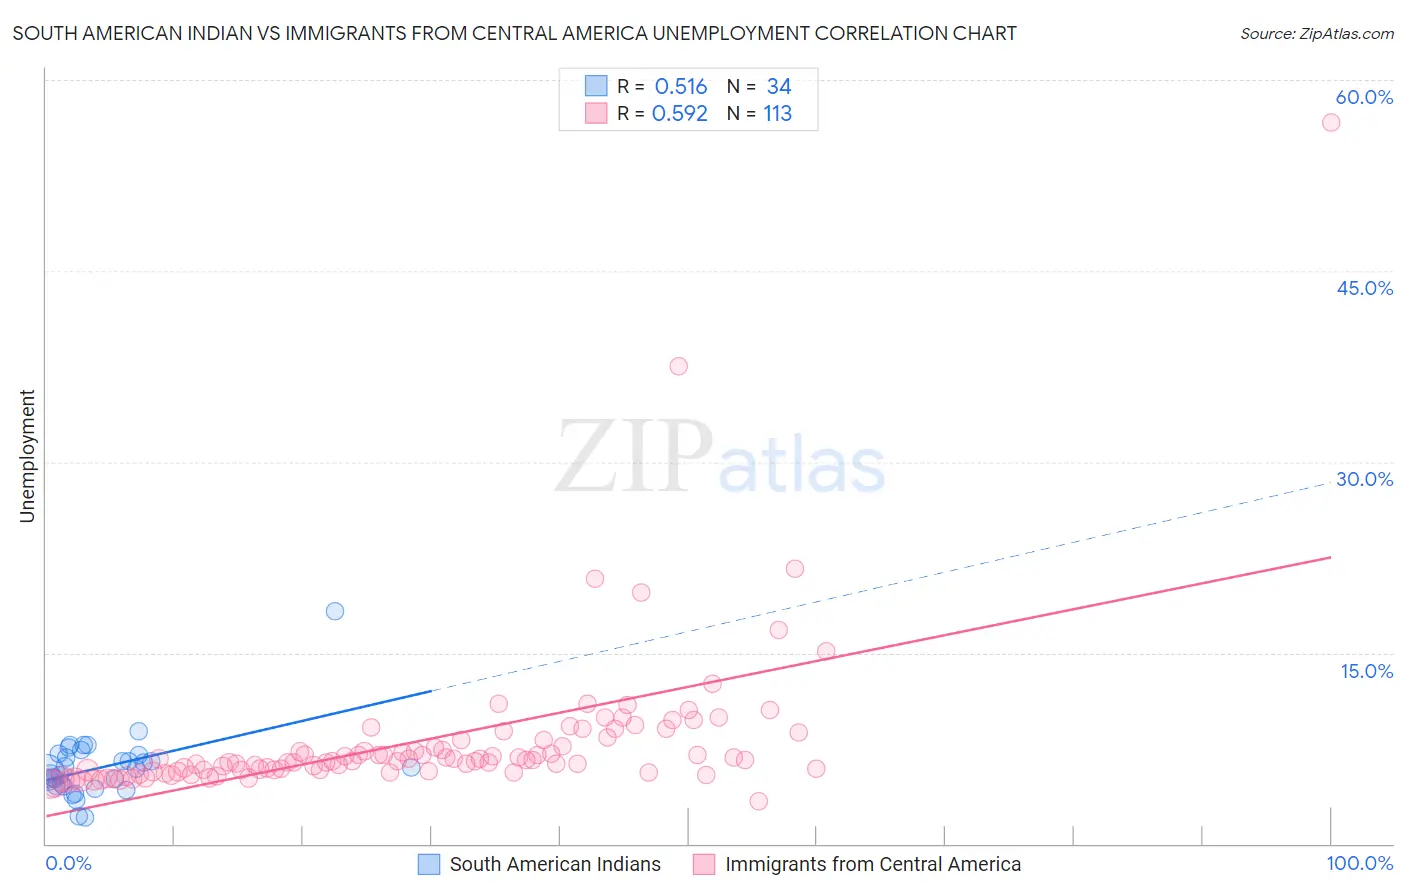
South American Indian vs Immigrants from Central America Unemployment Correlation Chart
The statistical analysis conducted on geographies consisting of 164,508,127 people shows a substantial positive correlation between the proportion of South American Indians and unemployment in the United States with a correlation coefficient (R) of 0.516 and weighted average of 5.5%. Similarly, the statistical analysis conducted on geographies consisting of 534,368,587 people shows a substantial positive correlation between the proportion of Immigrants from Central America and unemployment in the United States with a correlation coefficient (R) of 0.592 and weighted average of 6.0%, a difference of 9.1%.
Unemployment Correlation Summary
| Measurement | South American Indian | Immigrants from Central America |
| Minimum | 2.1% | 3.3% |
| Maximum | 18.3% | 56.6% |
| Range | 16.2% | 53.3% |
| Mean | 6.0% | 8.1% |
| Median | 5.8% | 6.5% |
| Interquartile 25% (IQ1) | 4.5% | 5.7% |
| Interquartile 75% (IQ3) | 7.0% | 8.1% |
| Interquartile Range (IQR) | 2.5% | 2.4% |
| Standard Deviation (Sample) | 2.7% | 6.2% |
| Standard Deviation (Population) | 2.6% | 6.2% |
Similar Demographics by Unemployment
Demographics Similar to South American Indians by Unemployment
In terms of unemployment, the demographic groups most similar to South American Indians are Samoan (5.5%, a difference of 0.15%), Immigrants from Lebanon (5.5%, a difference of 0.18%), Israeli (5.4%, a difference of 0.20%), Seminole (5.4%, a difference of 0.27%), and Guamanian/Chamorro (5.5%, a difference of 0.33%).
| Demographics | Rating | Rank | Unemployment |
| Choctaw | 12.7 /100 | #218 | Poor 5.4% |
| Bangladeshis | 11.2 /100 | #219 | Poor 5.4% |
| Soviet Union | 10.6 /100 | #220 | Poor 5.4% |
| Immigrants | Philippines | 10.4 /100 | #221 | Poor 5.4% |
| Iroquois | 10.3 /100 | #222 | Poor 5.4% |
| Seminole | 9.2 /100 | #223 | Tragic 5.4% |
| Israelis | 8.8 /100 | #224 | Tragic 5.4% |
| South American Indians | 7.8 /100 | #225 | Tragic 5.5% |
| Samoans | 7.1 /100 | #226 | Tragic 5.5% |
| Immigrants | Lebanon | 7.0 /100 | #227 | Tragic 5.5% |
| Guamanians/Chamorros | 6.3 /100 | #228 | Tragic 5.5% |
| Hawaiians | 5.4 /100 | #229 | Tragic 5.5% |
| Ottawa | 5.4 /100 | #230 | Tragic 5.5% |
| Immigrants | Africa | 4.9 /100 | #231 | Tragic 5.5% |
| Comanche | 4.9 /100 | #232 | Tragic 5.5% |
Demographics Similar to Immigrants from Central America by Unemployment
In terms of unemployment, the demographic groups most similar to Immigrants from Central America are Immigrants from Latin America (5.9%, a difference of 0.28%), Armenian (6.0%, a difference of 0.35%), Bahamian (5.9%, a difference of 0.49%), Ghanaian (6.0%, a difference of 0.64%), and Immigrants from Fiji (5.9%, a difference of 0.78%).
| Demographics | Rating | Rank | Unemployment |
| Immigrants | El Salvador | 0.1 /100 | #269 | Tragic 5.8% |
| Blackfeet | 0.1 /100 | #270 | Tragic 5.8% |
| Mexicans | 0.1 /100 | #271 | Tragic 5.9% |
| Hispanics or Latinos | 0.0 /100 | #272 | Tragic 5.9% |
| Immigrants | Fiji | 0.0 /100 | #273 | Tragic 5.9% |
| Bahamians | 0.0 /100 | #274 | Tragic 5.9% |
| Immigrants | Latin America | 0.0 /100 | #275 | Tragic 5.9% |
| Immigrants | Central America | 0.0 /100 | #276 | Tragic 6.0% |
| Armenians | 0.0 /100 | #277 | Tragic 6.0% |
| Ghanaians | 0.0 /100 | #278 | Tragic 6.0% |
| Immigrants | Mexico | 0.0 /100 | #279 | Tragic 6.0% |
| Immigrants | Western Africa | 0.0 /100 | #280 | Tragic 6.0% |
| Africans | 0.0 /100 | #281 | Tragic 6.1% |
| Immigrants | Azores | 0.0 /100 | #282 | Tragic 6.1% |
| Immigrants | Ghana | 0.0 /100 | #283 | Tragic 6.1% |