Slavic vs Immigrants from Philippines Female Unemployment
COMPARE
Slavic
Immigrants from Philippines
Female Unemployment
Female Unemployment Comparison
Slavs
Immigrants from Philippines
4.9%
FEMALE UNEMPLOYMENT
99.1/ 100
METRIC RATING
52nd/ 347
METRIC RANK
5.5%
FEMALE UNEMPLOYMENT
5.3/ 100
METRIC RATING
227th/ 347
METRIC RANK
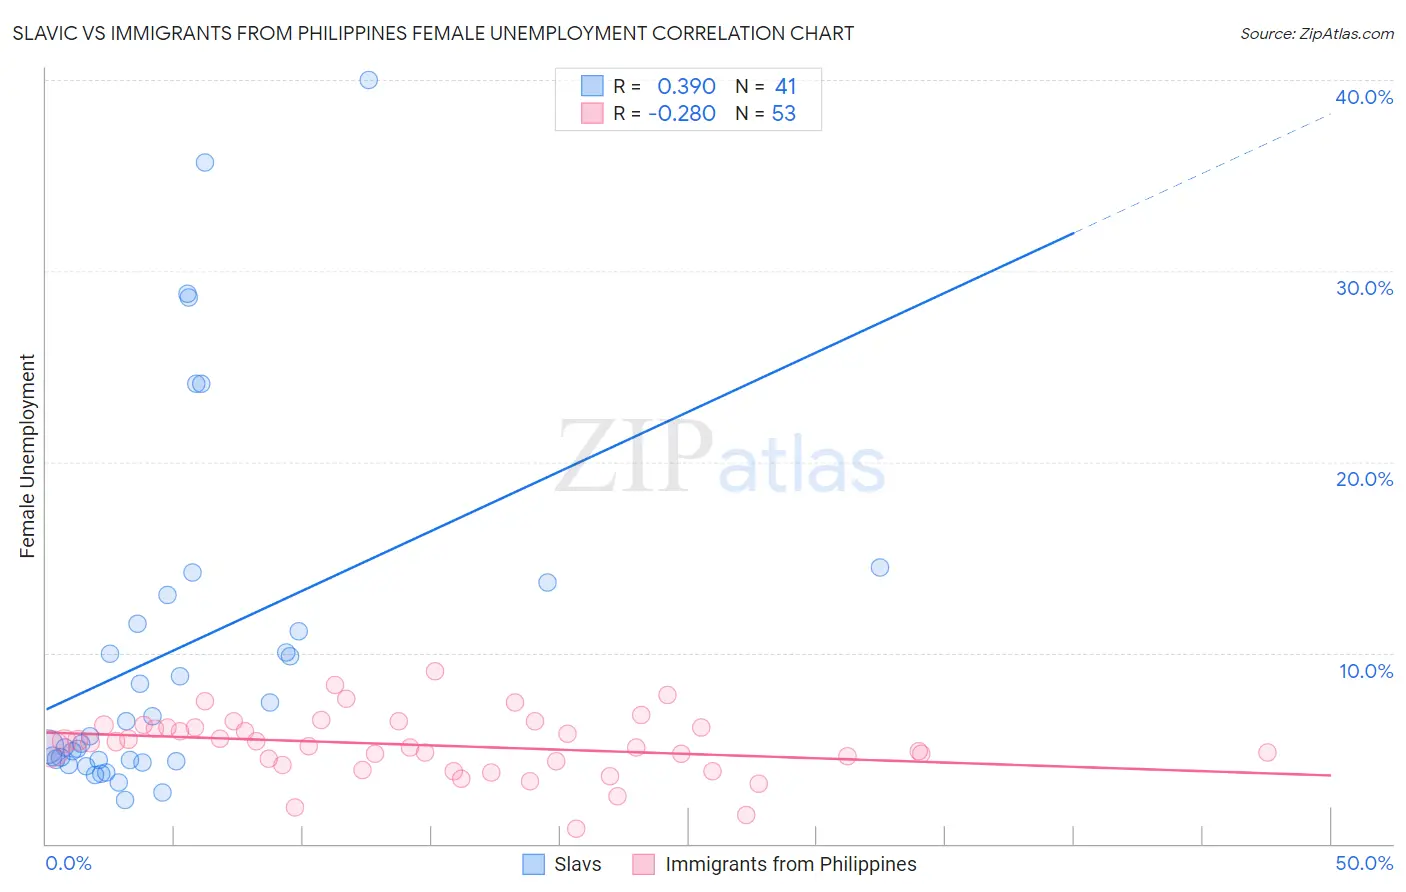
Slavic vs Immigrants from Philippines Female Unemployment Correlation Chart
The statistical analysis conducted on geographies consisting of 269,881,664 people shows a mild positive correlation between the proportion of Slavs and unemploymnet rate among females in the United States with a correlation coefficient (R) of 0.390 and weighted average of 4.9%. Similarly, the statistical analysis conducted on geographies consisting of 468,047,266 people shows a weak negative correlation between the proportion of Immigrants from Philippines and unemploymnet rate among females in the United States with a correlation coefficient (R) of -0.280 and weighted average of 5.5%, a difference of 12.2%.
Female Unemployment Correlation Summary
| Measurement | Slavic | Immigrants from Philippines |
| Minimum | 2.3% | 0.80% |
| Maximum | 40.0% | 9.0% |
| Range | 37.7% | 8.2% |
| Mean | 10.1% | 5.2% |
| Median | 5.7% | 5.3% |
| Interquartile 25% (IQ1) | 4.3% | 4.2% |
| Interquartile 75% (IQ3) | 12.3% | 6.2% |
| Interquartile Range (IQR) | 7.9% | 1.9% |
| Standard Deviation (Sample) | 9.3% | 1.6% |
| Standard Deviation (Population) | 9.2% | 1.6% |
Similar Demographics by Female Unemployment
Demographics Similar to Slavs by Female Unemployment
In terms of female unemployment, the demographic groups most similar to Slavs are Cambodian (4.9%, a difference of 0.020%), White/Caucasian (4.9%, a difference of 0.030%), Immigrants from Cuba (4.9%, a difference of 0.040%), Immigrants from Zimbabwe (4.9%, a difference of 0.090%), and Immigrants from Moldova (4.9%, a difference of 0.10%).
| Demographics | Rating | Rank | Female Unemployment |
| Austrians | 99.3 /100 | #45 | Exceptional 4.9% |
| Immigrants | Bulgaria | 99.3 /100 | #46 | Exceptional 4.9% |
| Okinawans | 99.3 /100 | #47 | Exceptional 4.9% |
| Thais | 99.2 /100 | #48 | Exceptional 4.9% |
| Australians | 99.2 /100 | #49 | Exceptional 4.9% |
| Immigrants | Cuba | 99.1 /100 | #50 | Exceptional 4.9% |
| Cambodians | 99.1 /100 | #51 | Exceptional 4.9% |
| Slavs | 99.1 /100 | #52 | Exceptional 4.9% |
| Whites/Caucasians | 99.0 /100 | #53 | Exceptional 4.9% |
| Immigrants | Zimbabwe | 99.0 /100 | #54 | Exceptional 4.9% |
| Immigrants | Moldova | 99.0 /100 | #55 | Exceptional 4.9% |
| Serbians | 99.0 /100 | #56 | Exceptional 4.9% |
| Icelanders | 98.8 /100 | #57 | Exceptional 4.9% |
| Immigrants | Lithuania | 98.8 /100 | #58 | Exceptional 4.9% |
| Bhutanese | 98.7 /100 | #59 | Exceptional 4.9% |
Demographics Similar to Immigrants from Philippines by Female Unemployment
In terms of female unemployment, the demographic groups most similar to Immigrants from Philippines are Israeli (5.5%, a difference of 0.16%), Immigrants from Peru (5.5%, a difference of 0.17%), Panamanian (5.5%, a difference of 0.17%), Immigrants from Uruguay (5.5%, a difference of 0.18%), and French American Indian (5.5%, a difference of 0.21%).
| Demographics | Rating | Rank | Female Unemployment |
| Immigrants | Africa | 8.5 /100 | #220 | Tragic 5.4% |
| Brazilians | 7.3 /100 | #221 | Tragic 5.5% |
| Nicaraguans | 7.2 /100 | #222 | Tragic 5.5% |
| Delaware | 7.2 /100 | #223 | Tragic 5.5% |
| Iraqis | 7.1 /100 | #224 | Tragic 5.5% |
| French American Indians | 6.1 /100 | #225 | Tragic 5.5% |
| Immigrants | Peru | 5.9 /100 | #226 | Tragic 5.5% |
| Immigrants | Philippines | 5.3 /100 | #227 | Tragic 5.5% |
| Israelis | 4.8 /100 | #228 | Tragic 5.5% |
| Panamanians | 4.7 /100 | #229 | Tragic 5.5% |
| Immigrants | Uruguay | 4.7 /100 | #230 | Tragic 5.5% |
| Immigrants | Iraq | 3.9 /100 | #231 | Tragic 5.5% |
| Liberians | 3.9 /100 | #232 | Tragic 5.5% |
| Moroccans | 3.4 /100 | #233 | Tragic 5.5% |
| Immigrants | Lebanon | 3.3 /100 | #234 | Tragic 5.5% |