Yakama vs Mongolian Unemployment Among Ages 20 to 24 years
COMPARE
Yakama
Mongolian
Unemployment Among Ages 20 to 24 years
Unemployment Among Ages 20 to 24 years Comparison
Yakama
Mongolians
13.1%
UNEMPLOYMENT AMONG AGES 20 TO 24 YEARS
0.0/ 100
METRIC RATING
323rd/ 347
METRIC RANK
9.9%
UNEMPLOYMENT AMONG AGES 20 TO 24 YEARS
99.1/ 100
METRIC RATING
68th/ 347
METRIC RANK
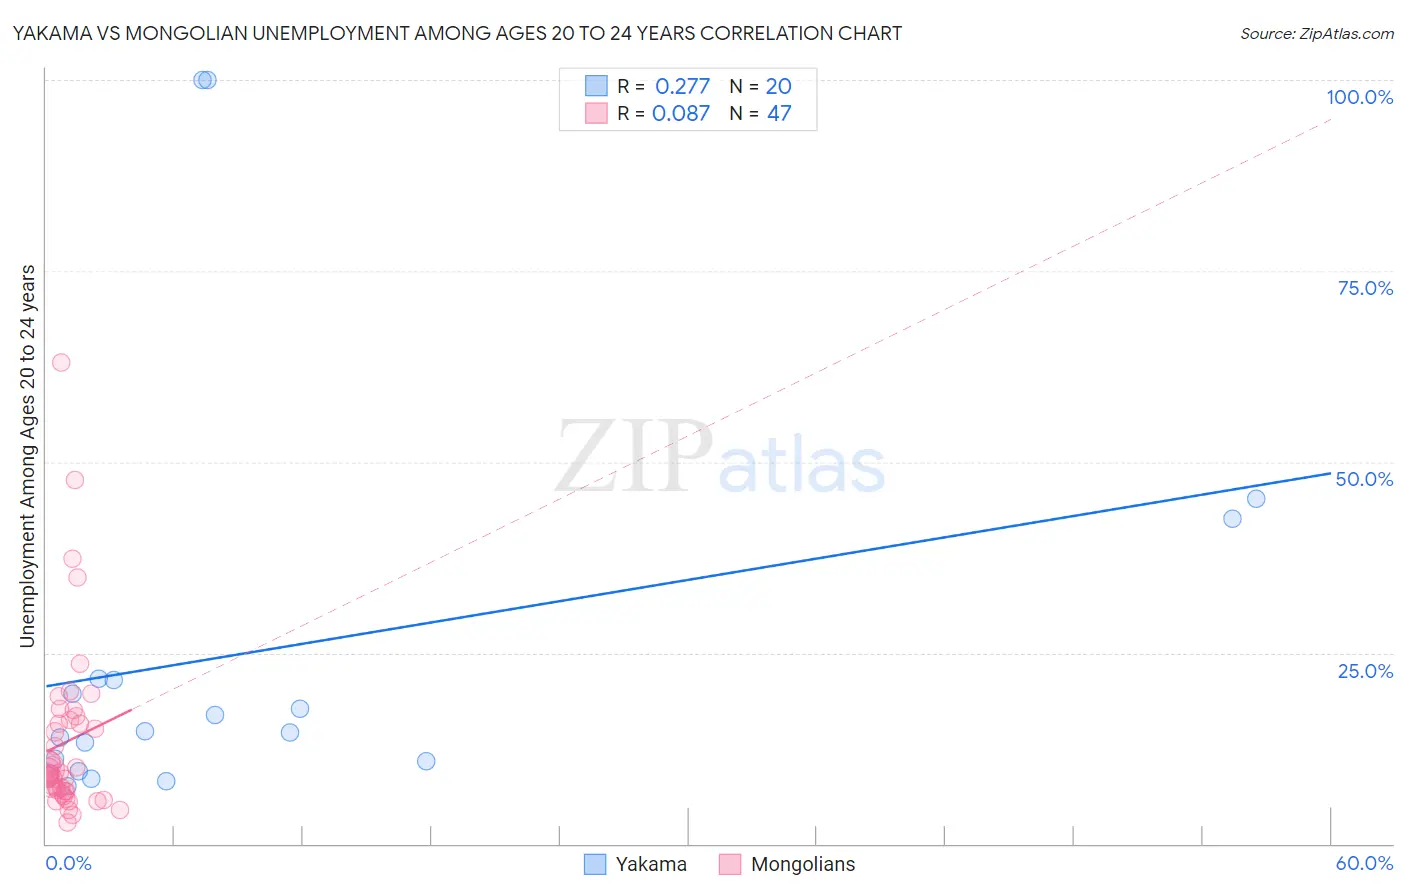
Yakama vs Mongolian Unemployment Among Ages 20 to 24 years Correlation Chart
The statistical analysis conducted on geographies consisting of 19,737,605 people shows a weak positive correlation between the proportion of Yakama and unemployment rate among population between the ages 20 and 24 in the United States with a correlation coefficient (R) of 0.277 and weighted average of 13.1%. Similarly, the statistical analysis conducted on geographies consisting of 139,247,610 people shows a slight positive correlation between the proportion of Mongolians and unemployment rate among population between the ages 20 and 24 in the United States with a correlation coefficient (R) of 0.087 and weighted average of 9.9%, a difference of 32.7%.
Unemployment Among Ages 20 to 24 years Correlation Summary
| Measurement | Yakama | Mongolian |
| Minimum | 7.5% | 2.8% |
| Maximum | 100.0% | 63.0% |
| Range | 92.5% | 60.1% |
| Mean | 25.3% | 13.4% |
| Median | 14.6% | 9.2% |
| Interquartile 25% (IQ1) | 10.2% | 6.8% |
| Interquartile 75% (IQ3) | 21.5% | 16.3% |
| Interquartile Range (IQR) | 11.3% | 9.5% |
| Standard Deviation (Sample) | 27.5% | 11.6% |
| Standard Deviation (Population) | 26.8% | 11.5% |
Similar Demographics by Unemployment Among Ages 20 to 24 years
Demographics Similar to Yakama by Unemployment Among Ages 20 to 24 years
In terms of unemployment among ages 20 to 24 years, the demographic groups most similar to Yakama are Native/Alaskan (13.0%, a difference of 0.48%), Immigrants from Jamaica (13.0%, a difference of 0.86%), Cheyenne (13.0%, a difference of 0.95%), Alaska Native (13.2%, a difference of 0.98%), and Pueblo (13.2%, a difference of 1.2%).
| Demographics | Rating | Rank | Unemployment Among Ages 20 to 24 years |
| Immigrants | Dominica | 0.0 /100 | #316 | Tragic 12.8% |
| Immigrants | Trinidad and Tobago | 0.0 /100 | #317 | Tragic 12.8% |
| Barbadians | 0.0 /100 | #318 | Tragic 12.9% |
| Trinidadians and Tobagonians | 0.0 /100 | #319 | Tragic 12.9% |
| Cheyenne | 0.0 /100 | #320 | Tragic 13.0% |
| Immigrants | Jamaica | 0.0 /100 | #321 | Tragic 13.0% |
| Natives/Alaskans | 0.0 /100 | #322 | Tragic 13.0% |
| Yakama | 0.0 /100 | #323 | Tragic 13.1% |
| Alaska Natives | 0.0 /100 | #324 | Tragic 13.2% |
| Pueblo | 0.0 /100 | #325 | Tragic 13.2% |
| Immigrants | Barbados | 0.0 /100 | #326 | Tragic 13.5% |
| Immigrants | Dominican Republic | 0.0 /100 | #327 | Tragic 13.6% |
| British West Indians | 0.0 /100 | #328 | Tragic 13.7% |
| Dominicans | 0.0 /100 | #329 | Tragic 13.8% |
| Arapaho | 0.0 /100 | #330 | Tragic 13.8% |
Demographics Similar to Mongolians by Unemployment Among Ages 20 to 24 years
In terms of unemployment among ages 20 to 24 years, the demographic groups most similar to Mongolians are Immigrants from Bolivia (9.9%, a difference of 0.050%), Bulgarian (9.9%, a difference of 0.080%), Scottish (9.8%, a difference of 0.17%), Immigrants from Croatia (9.9%, a difference of 0.20%), and Celtic (9.9%, a difference of 0.23%).
| Demographics | Rating | Rank | Unemployment Among Ages 20 to 24 years |
| Malaysians | 99.5 /100 | #61 | Exceptional 9.8% |
| Immigrants | Singapore | 99.4 /100 | #62 | Exceptional 9.8% |
| British | 99.4 /100 | #63 | Exceptional 9.8% |
| Serbians | 99.4 /100 | #64 | Exceptional 9.8% |
| Welsh | 99.3 /100 | #65 | Exceptional 9.8% |
| Scottish | 99.3 /100 | #66 | Exceptional 9.8% |
| Immigrants | Bolivia | 99.2 /100 | #67 | Exceptional 9.9% |
| Mongolians | 99.1 /100 | #68 | Exceptional 9.9% |
| Bulgarians | 99.1 /100 | #69 | Exceptional 9.9% |
| Immigrants | Croatia | 99.0 /100 | #70 | Exceptional 9.9% |
| Celtics | 98.9 /100 | #71 | Exceptional 9.9% |
| Bolivians | 98.9 /100 | #72 | Exceptional 9.9% |
| Kenyans | 98.7 /100 | #73 | Exceptional 9.9% |
| Immigrants | Laos | 98.7 /100 | #74 | Exceptional 9.9% |
| Immigrants | Australia | 98.6 /100 | #75 | Exceptional 9.9% |