Palestinian vs Mongolian Unemployment Among Ages 20 to 24 years
COMPARE
Palestinian
Mongolian
Unemployment Among Ages 20 to 24 years
Unemployment Among Ages 20 to 24 years Comparison
Palestinians
Mongolians
10.6%
UNEMPLOYMENT AMONG AGES 20 TO 24 YEARS
4.9/ 100
METRIC RATING
227th/ 347
METRIC RANK
9.9%
UNEMPLOYMENT AMONG AGES 20 TO 24 YEARS
99.1/ 100
METRIC RATING
68th/ 347
METRIC RANK
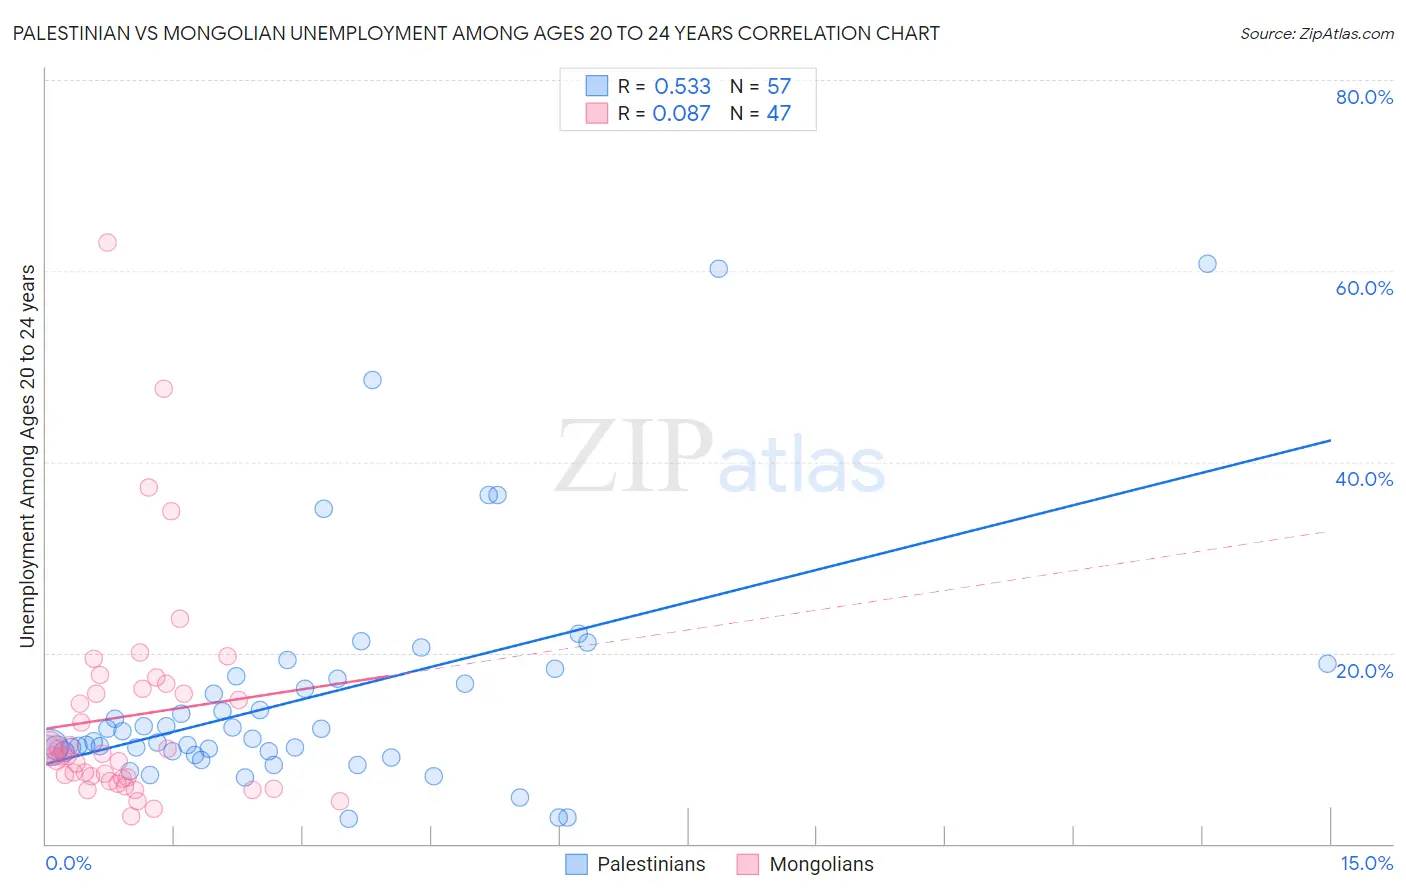
Palestinian vs Mongolian Unemployment Among Ages 20 to 24 years Correlation Chart
The statistical analysis conducted on geographies consisting of 214,060,905 people shows a substantial positive correlation between the proportion of Palestinians and unemployment rate among population between the ages 20 and 24 in the United States with a correlation coefficient (R) of 0.533 and weighted average of 10.6%. Similarly, the statistical analysis conducted on geographies consisting of 139,247,610 people shows a slight positive correlation between the proportion of Mongolians and unemployment rate among population between the ages 20 and 24 in the United States with a correlation coefficient (R) of 0.087 and weighted average of 9.9%, a difference of 7.4%.
Unemployment Among Ages 20 to 24 years Correlation Summary
| Measurement | Palestinian | Mongolian |
| Minimum | 2.6% | 2.8% |
| Maximum | 60.8% | 63.0% |
| Range | 58.2% | 60.1% |
| Mean | 15.4% | 13.4% |
| Median | 11.1% | 9.2% |
| Interquartile 25% (IQ1) | 9.7% | 6.8% |
| Interquartile 75% (IQ3) | 17.4% | 16.3% |
| Interquartile Range (IQR) | 7.8% | 9.5% |
| Standard Deviation (Sample) | 12.1% | 11.6% |
| Standard Deviation (Population) | 12.0% | 11.5% |
Similar Demographics by Unemployment Among Ages 20 to 24 years
Demographics Similar to Palestinians by Unemployment Among Ages 20 to 24 years
In terms of unemployment among ages 20 to 24 years, the demographic groups most similar to Palestinians are Immigrants from Costa Rica (10.6%, a difference of 0.0%), Immigrants from South America (10.6%, a difference of 0.030%), Nepalese (10.6%, a difference of 0.040%), Mexican American Indian (10.6%, a difference of 0.070%), and American (10.6%, a difference of 0.11%).
| Demographics | Rating | Rank | Unemployment Among Ages 20 to 24 years |
| Eastern Europeans | 6.9 /100 | #220 | Tragic 10.6% |
| Central Americans | 6.8 /100 | #221 | Tragic 10.6% |
| Immigrants | Poland | 6.4 /100 | #222 | Tragic 10.6% |
| Arabs | 5.6 /100 | #223 | Tragic 10.6% |
| Nepalese | 5.1 /100 | #224 | Tragic 10.6% |
| Immigrants | South America | 5.1 /100 | #225 | Tragic 10.6% |
| Immigrants | Costa Rica | 4.9 /100 | #226 | Tragic 10.6% |
| Palestinians | 4.9 /100 | #227 | Tragic 10.6% |
| Mexican American Indians | 4.6 /100 | #228 | Tragic 10.6% |
| Americans | 4.4 /100 | #229 | Tragic 10.6% |
| French American Indians | 4.1 /100 | #230 | Tragic 10.6% |
| Native Hawaiians | 3.9 /100 | #231 | Tragic 10.6% |
| Israelis | 3.7 /100 | #232 | Tragic 10.6% |
| Choctaw | 3.6 /100 | #233 | Tragic 10.6% |
| Immigrants | Africa | 3.5 /100 | #234 | Tragic 10.6% |
Demographics Similar to Mongolians by Unemployment Among Ages 20 to 24 years
In terms of unemployment among ages 20 to 24 years, the demographic groups most similar to Mongolians are Immigrants from Bolivia (9.9%, a difference of 0.050%), Bulgarian (9.9%, a difference of 0.080%), Scottish (9.8%, a difference of 0.17%), Immigrants from Croatia (9.9%, a difference of 0.20%), and Celtic (9.9%, a difference of 0.23%).
| Demographics | Rating | Rank | Unemployment Among Ages 20 to 24 years |
| Malaysians | 99.5 /100 | #61 | Exceptional 9.8% |
| Immigrants | Singapore | 99.4 /100 | #62 | Exceptional 9.8% |
| British | 99.4 /100 | #63 | Exceptional 9.8% |
| Serbians | 99.4 /100 | #64 | Exceptional 9.8% |
| Welsh | 99.3 /100 | #65 | Exceptional 9.8% |
| Scottish | 99.3 /100 | #66 | Exceptional 9.8% |
| Immigrants | Bolivia | 99.2 /100 | #67 | Exceptional 9.9% |
| Mongolians | 99.1 /100 | #68 | Exceptional 9.9% |
| Bulgarians | 99.1 /100 | #69 | Exceptional 9.9% |
| Immigrants | Croatia | 99.0 /100 | #70 | Exceptional 9.9% |
| Celtics | 98.9 /100 | #71 | Exceptional 9.9% |
| Bolivians | 98.9 /100 | #72 | Exceptional 9.9% |
| Kenyans | 98.7 /100 | #73 | Exceptional 9.9% |
| Immigrants | Laos | 98.7 /100 | #74 | Exceptional 9.9% |
| Immigrants | Australia | 98.6 /100 | #75 | Exceptional 9.9% |