Sri Lankan vs Mongolian Unemployment Among Ages 20 to 24 years
COMPARE
Sri Lankan
Mongolian
Unemployment Among Ages 20 to 24 years
Unemployment Among Ages 20 to 24 years Comparison
Sri Lankans
Mongolians
9.9%
UNEMPLOYMENT AMONG AGES 20 TO 24 YEARS
98.0/ 100
METRIC RATING
82nd/ 347
METRIC RANK
9.9%
UNEMPLOYMENT AMONG AGES 20 TO 24 YEARS
99.1/ 100
METRIC RATING
68th/ 347
METRIC RANK
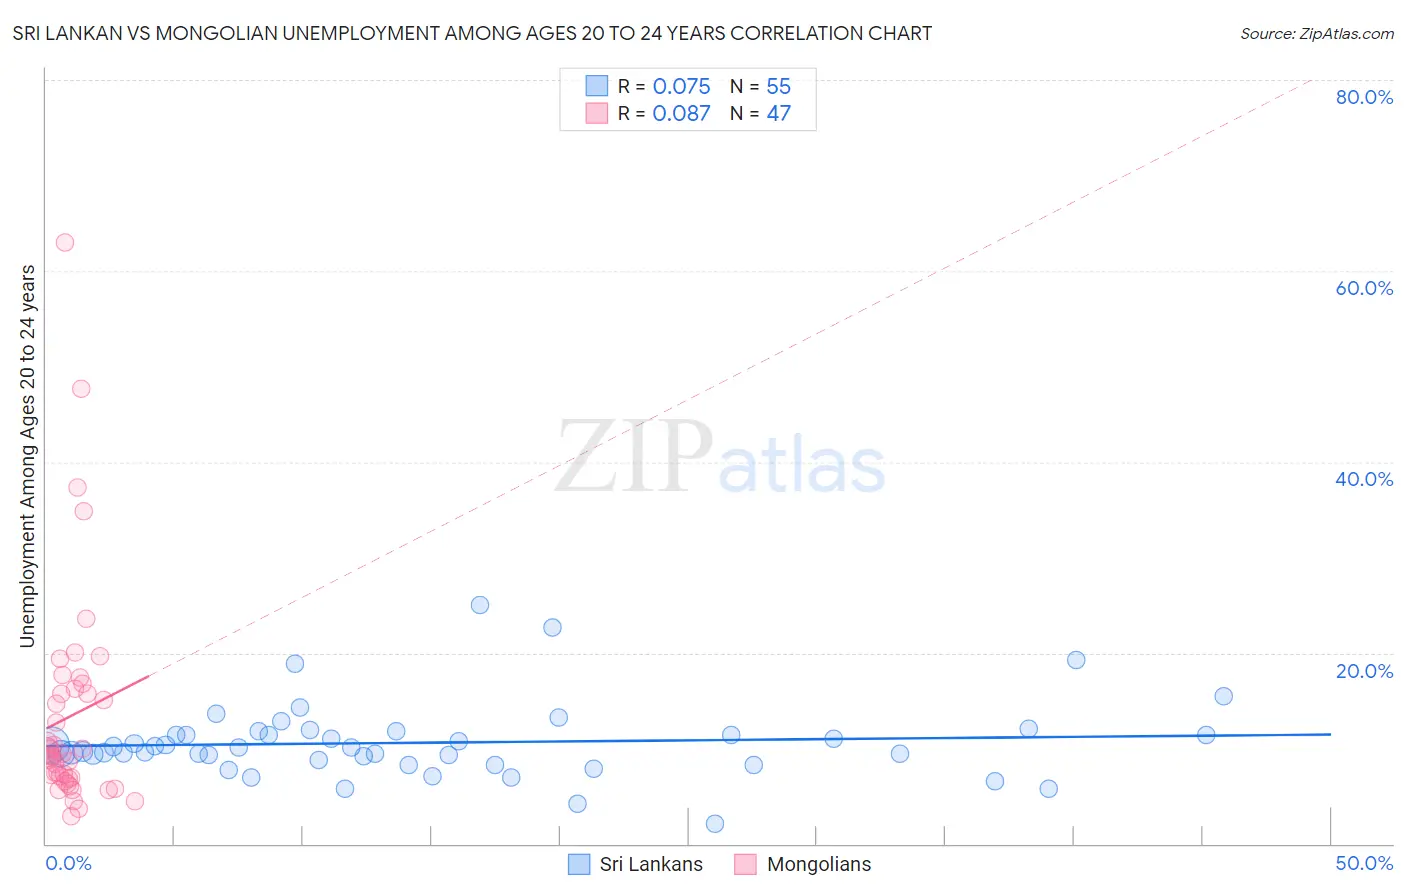
Sri Lankan vs Mongolian Unemployment Among Ages 20 to 24 years Correlation Chart
The statistical analysis conducted on geographies consisting of 426,757,602 people shows a slight positive correlation between the proportion of Sri Lankans and unemployment rate among population between the ages 20 and 24 in the United States with a correlation coefficient (R) of 0.075 and weighted average of 9.9%. Similarly, the statistical analysis conducted on geographies consisting of 139,247,610 people shows a slight positive correlation between the proportion of Mongolians and unemployment rate among population between the ages 20 and 24 in the United States with a correlation coefficient (R) of 0.087 and weighted average of 9.9%, a difference of 0.83%.
Unemployment Among Ages 20 to 24 years Correlation Summary
| Measurement | Sri Lankan | Mongolian |
| Minimum | 2.2% | 2.8% |
| Maximum | 25.0% | 63.0% |
| Range | 22.9% | 60.1% |
| Mean | 10.6% | 13.4% |
| Median | 10.1% | 9.2% |
| Interquartile 25% (IQ1) | 8.8% | 6.8% |
| Interquartile 75% (IQ3) | 11.4% | 16.3% |
| Interquartile Range (IQR) | 2.7% | 9.5% |
| Standard Deviation (Sample) | 3.9% | 11.6% |
| Standard Deviation (Population) | 3.9% | 11.5% |
Demographics Similar to Sri Lankans and Mongolians by Unemployment Among Ages 20 to 24 years
In terms of unemployment among ages 20 to 24 years, the demographic groups most similar to Sri Lankans are Yaqui (9.9%, a difference of 0.0%), Immigrants from Bulgaria (9.9%, a difference of 0.020%), Latvian (9.9%, a difference of 0.030%), New Zealander (9.9%, a difference of 0.070%), and Immigrants from Netherlands (9.9%, a difference of 0.12%). Similarly, the demographic groups most similar to Mongolians are Immigrants from Bolivia (9.9%, a difference of 0.050%), Bulgarian (9.9%, a difference of 0.080%), Scottish (9.8%, a difference of 0.17%), Immigrants from Croatia (9.9%, a difference of 0.20%), and Celtic (9.9%, a difference of 0.23%).
| Demographics | Rating | Rank | Unemployment Among Ages 20 to 24 years |
| Welsh | 99.3 /100 | #65 | Exceptional 9.8% |
| Scottish | 99.3 /100 | #66 | Exceptional 9.8% |
| Immigrants | Bolivia | 99.2 /100 | #67 | Exceptional 9.9% |
| Mongolians | 99.1 /100 | #68 | Exceptional 9.9% |
| Bulgarians | 99.1 /100 | #69 | Exceptional 9.9% |
| Immigrants | Croatia | 99.0 /100 | #70 | Exceptional 9.9% |
| Celtics | 98.9 /100 | #71 | Exceptional 9.9% |
| Bolivians | 98.9 /100 | #72 | Exceptional 9.9% |
| Kenyans | 98.7 /100 | #73 | Exceptional 9.9% |
| Immigrants | Laos | 98.7 /100 | #74 | Exceptional 9.9% |
| Immigrants | Australia | 98.6 /100 | #75 | Exceptional 9.9% |
| Czechoslovakians | 98.4 /100 | #76 | Exceptional 9.9% |
| Chickasaw | 98.4 /100 | #77 | Exceptional 9.9% |
| Assyrians/Chaldeans/Syriacs | 98.3 /100 | #78 | Exceptional 9.9% |
| Icelanders | 98.3 /100 | #79 | Exceptional 9.9% |
| Immigrants | Netherlands | 98.2 /100 | #80 | Exceptional 9.9% |
| Yaqui | 98.0 /100 | #81 | Exceptional 9.9% |
| Sri Lankans | 98.0 /100 | #82 | Exceptional 9.9% |
| Immigrants | Bulgaria | 98.0 /100 | #83 | Exceptional 9.9% |
| Latvians | 97.9 /100 | #84 | Exceptional 9.9% |
| New Zealanders | 97.8 /100 | #85 | Exceptional 9.9% |