Scandinavian vs Immigrants from Bulgaria Unemployment
COMPARE
Scandinavian
Immigrants from Bulgaria
Unemployment
Unemployment Comparison
Scandinavians
Immigrants from Bulgaria
4.5%
UNEMPLOYMENT
100.0/ 100
METRIC RATING
9th/ 347
METRIC RANK
4.9%
UNEMPLOYMENT
98.9/ 100
METRIC RATING
63rd/ 347
METRIC RANK
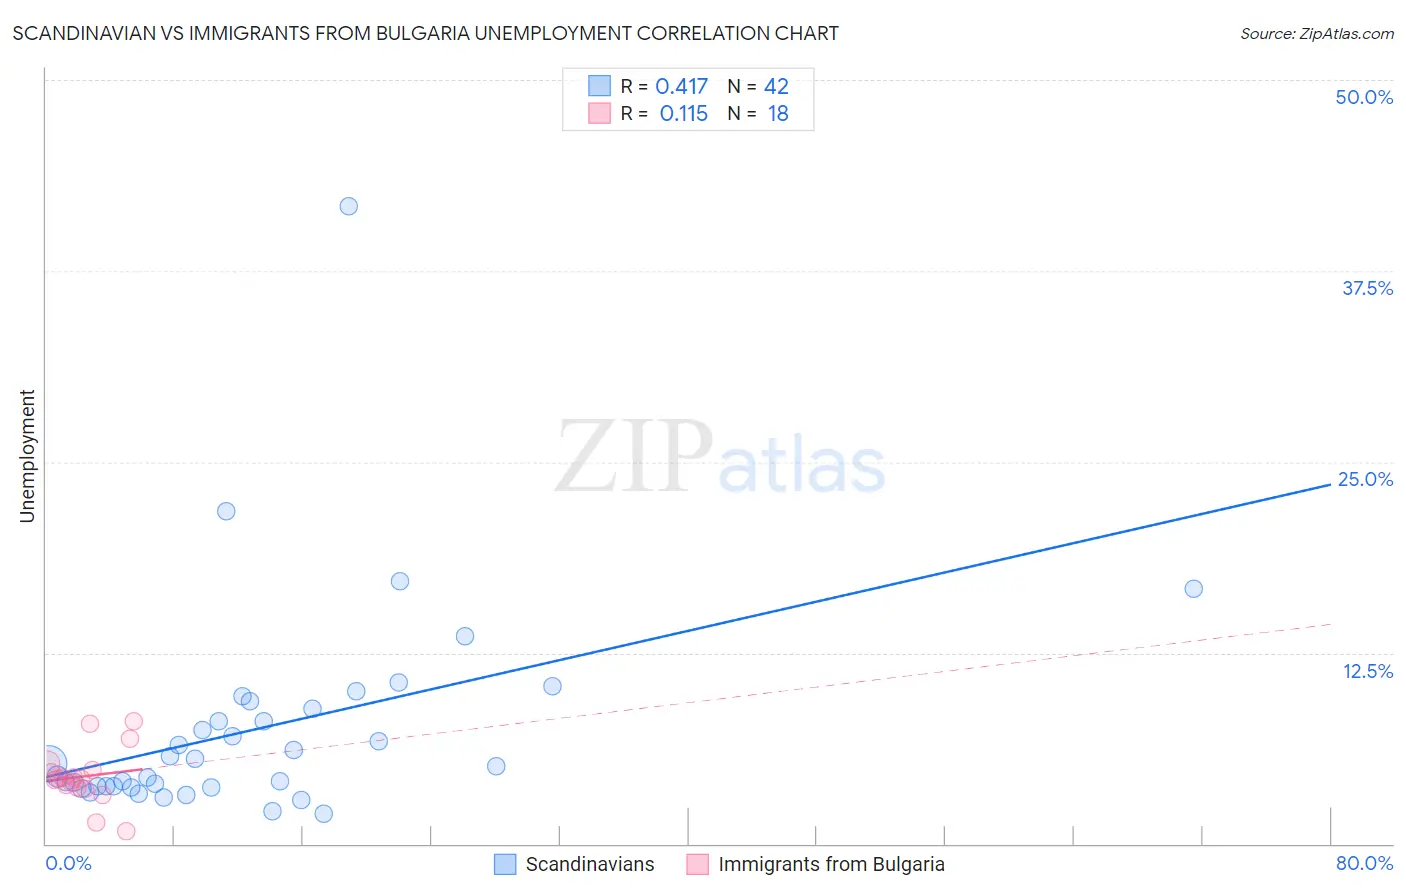
Scandinavian vs Immigrants from Bulgaria Unemployment Correlation Chart
The statistical analysis conducted on geographies consisting of 471,134,185 people shows a moderate positive correlation between the proportion of Scandinavians and unemployment in the United States with a correlation coefficient (R) of 0.417 and weighted average of 4.5%. Similarly, the statistical analysis conducted on geographies consisting of 172,511,279 people shows a poor positive correlation between the proportion of Immigrants from Bulgaria and unemployment in the United States with a correlation coefficient (R) of 0.115 and weighted average of 4.9%, a difference of 7.6%.
Unemployment Correlation Summary
| Measurement | Scandinavian | Immigrants from Bulgaria |
| Minimum | 2.0% | 0.80% |
| Maximum | 41.7% | 8.0% |
| Range | 39.7% | 7.2% |
| Mean | 7.4% | 4.4% |
| Median | 5.2% | 4.2% |
| Interquartile 25% (IQ1) | 3.7% | 3.6% |
| Interquartile 75% (IQ3) | 8.8% | 4.9% |
| Interquartile Range (IQR) | 5.1% | 1.2% |
| Standard Deviation (Sample) | 6.9% | 1.8% |
| Standard Deviation (Population) | 6.8% | 1.8% |
Similar Demographics by Unemployment
Demographics Similar to Scandinavians by Unemployment
In terms of unemployment, the demographic groups most similar to Scandinavians are Swiss (4.5%, a difference of 0.39%), Dutch (4.6%, a difference of 0.51%), Immigrants from India (4.5%, a difference of 0.86%), English (4.6%, a difference of 1.2%), and Pennsylvania German (4.6%, a difference of 1.3%).
| Demographics | Rating | Rank | Unemployment |
| Luxembourgers | 100.0 /100 | #2 | Exceptional 4.3% |
| Czechs | 100.0 /100 | #3 | Exceptional 4.3% |
| Danes | 100.0 /100 | #4 | Exceptional 4.3% |
| Swedes | 100.0 /100 | #5 | Exceptional 4.4% |
| Germans | 100.0 /100 | #6 | Exceptional 4.5% |
| Immigrants | India | 100.0 /100 | #7 | Exceptional 4.5% |
| Swiss | 100.0 /100 | #8 | Exceptional 4.5% |
| Scandinavians | 100.0 /100 | #9 | Exceptional 4.5% |
| Dutch | 100.0 /100 | #10 | Exceptional 4.6% |
| English | 100.0 /100 | #11 | Exceptional 4.6% |
| Pennsylvania Germans | 100.0 /100 | #12 | Exceptional 4.6% |
| Belgians | 100.0 /100 | #13 | Exceptional 4.6% |
| Immigrants | Cuba | 100.0 /100 | #14 | Exceptional 4.6% |
| Europeans | 99.9 /100 | #15 | Exceptional 4.6% |
| Chinese | 99.9 /100 | #16 | Exceptional 4.7% |
Demographics Similar to Immigrants from Bulgaria by Unemployment
In terms of unemployment, the demographic groups most similar to Immigrants from Bulgaria are Icelander (4.9%, a difference of 0.010%), Immigrants from Netherlands (4.9%, a difference of 0.030%), Cambodian (4.9%, a difference of 0.030%), Bhutanese (4.9%, a difference of 0.070%), and Italian (4.9%, a difference of 0.080%).
| Demographics | Rating | Rank | Unemployment |
| Celtics | 99.1 /100 | #56 | Exceptional 4.9% |
| Immigrants | Singapore | 99.1 /100 | #57 | Exceptional 4.9% |
| Greeks | 99.0 /100 | #58 | Exceptional 4.9% |
| Bhutanese | 99.0 /100 | #59 | Exceptional 4.9% |
| Immigrants | Netherlands | 99.0 /100 | #60 | Exceptional 4.9% |
| Cambodians | 99.0 /100 | #61 | Exceptional 4.9% |
| Icelanders | 98.9 /100 | #62 | Exceptional 4.9% |
| Immigrants | Bulgaria | 98.9 /100 | #63 | Exceptional 4.9% |
| Italians | 98.9 /100 | #64 | Exceptional 4.9% |
| Immigrants | Canada | 98.8 /100 | #65 | Exceptional 4.9% |
| Slovaks | 98.7 /100 | #66 | Exceptional 4.9% |
| New Zealanders | 98.6 /100 | #67 | Exceptional 4.9% |
| Slavs | 98.6 /100 | #68 | Exceptional 4.9% |
| Immigrants | North America | 98.5 /100 | #69 | Exceptional 4.9% |
| Serbians | 98.4 /100 | #70 | Exceptional 4.9% |