Scandinavian vs Alsatian Unemployment
COMPARE
Scandinavian
Alsatian
Unemployment
Unemployment Comparison
Scandinavians
Alsatians
4.5%
UNEMPLOYMENT
100.0/ 100
METRIC RATING
9th/ 347
METRIC RANK
5.3%
UNEMPLOYMENT
37.0/ 100
METRIC RATING
188th/ 347
METRIC RANK
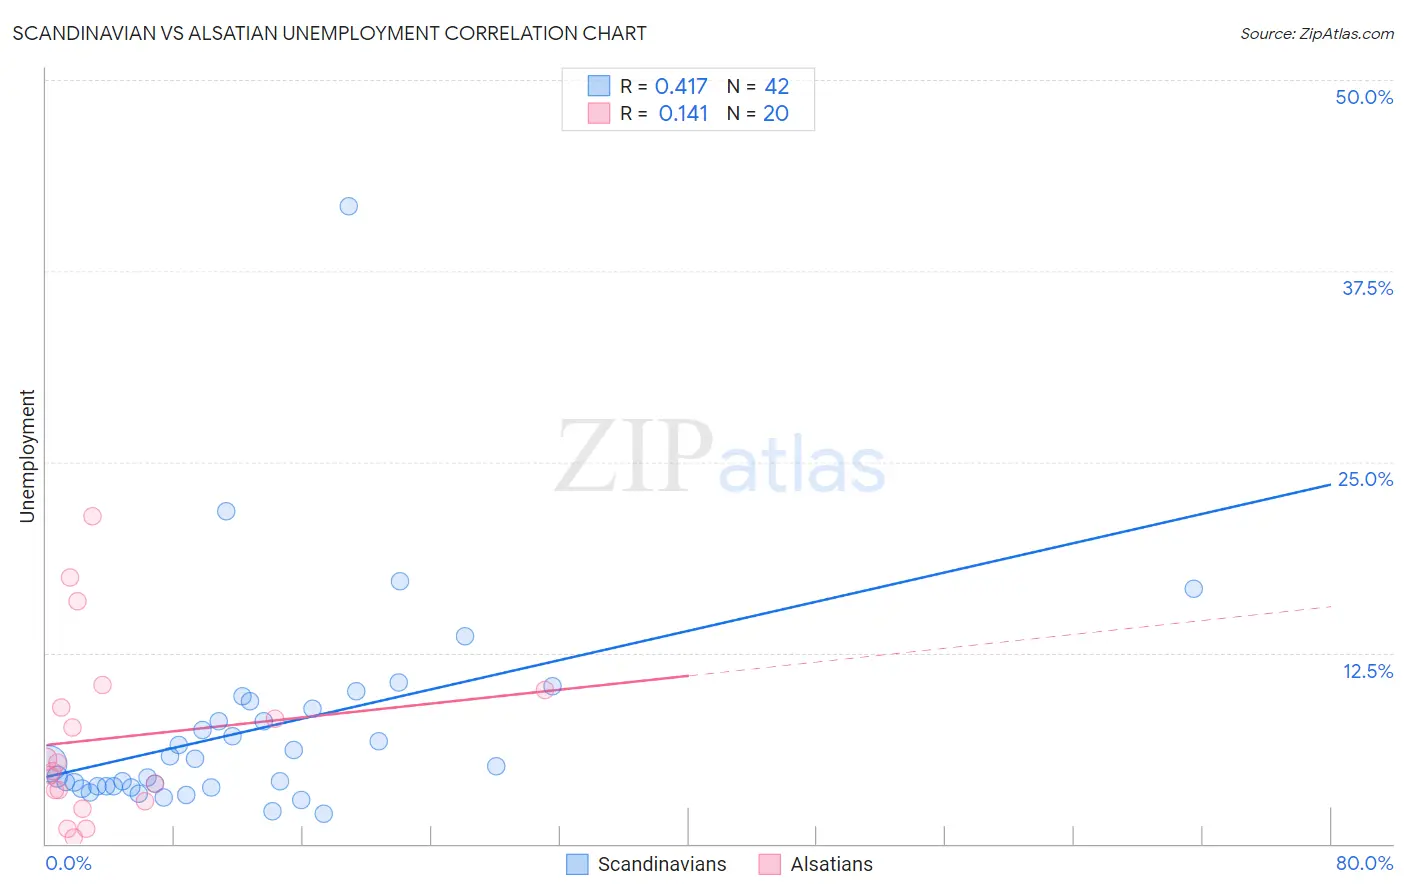
Scandinavian vs Alsatian Unemployment Correlation Chart
The statistical analysis conducted on geographies consisting of 471,134,185 people shows a moderate positive correlation between the proportion of Scandinavians and unemployment in the United States with a correlation coefficient (R) of 0.417 and weighted average of 4.5%. Similarly, the statistical analysis conducted on geographies consisting of 82,657,373 people shows a poor positive correlation between the proportion of Alsatians and unemployment in the United States with a correlation coefficient (R) of 0.141 and weighted average of 5.3%, a difference of 16.6%.
Unemployment Correlation Summary
| Measurement | Scandinavian | Alsatian |
| Minimum | 2.0% | 0.40% |
| Maximum | 41.7% | 21.4% |
| Range | 39.7% | 21.0% |
| Mean | 7.4% | 6.9% |
| Median | 5.2% | 5.0% |
| Interquartile 25% (IQ1) | 3.7% | 3.1% |
| Interquartile 75% (IQ3) | 8.8% | 9.5% |
| Interquartile Range (IQR) | 5.1% | 6.4% |
| Standard Deviation (Sample) | 6.9% | 5.7% |
| Standard Deviation (Population) | 6.8% | 5.6% |
Similar Demographics by Unemployment
Demographics Similar to Scandinavians by Unemployment
In terms of unemployment, the demographic groups most similar to Scandinavians are Swiss (4.5%, a difference of 0.39%), Dutch (4.6%, a difference of 0.51%), Immigrants from India (4.5%, a difference of 0.86%), English (4.6%, a difference of 1.2%), and Pennsylvania German (4.6%, a difference of 1.3%).
| Demographics | Rating | Rank | Unemployment |
| Luxembourgers | 100.0 /100 | #2 | Exceptional 4.3% |
| Czechs | 100.0 /100 | #3 | Exceptional 4.3% |
| Danes | 100.0 /100 | #4 | Exceptional 4.3% |
| Swedes | 100.0 /100 | #5 | Exceptional 4.4% |
| Germans | 100.0 /100 | #6 | Exceptional 4.5% |
| Immigrants | India | 100.0 /100 | #7 | Exceptional 4.5% |
| Swiss | 100.0 /100 | #8 | Exceptional 4.5% |
| Scandinavians | 100.0 /100 | #9 | Exceptional 4.5% |
| Dutch | 100.0 /100 | #10 | Exceptional 4.6% |
| English | 100.0 /100 | #11 | Exceptional 4.6% |
| Pennsylvania Germans | 100.0 /100 | #12 | Exceptional 4.6% |
| Belgians | 100.0 /100 | #13 | Exceptional 4.6% |
| Immigrants | Cuba | 100.0 /100 | #14 | Exceptional 4.6% |
| Europeans | 99.9 /100 | #15 | Exceptional 4.6% |
| Chinese | 99.9 /100 | #16 | Exceptional 4.7% |
Demographics Similar to Alsatians by Unemployment
In terms of unemployment, the demographic groups most similar to Alsatians are Costa Rican (5.3%, a difference of 0.020%), Immigrants from Uganda (5.3%, a difference of 0.050%), Immigrants from Belarus (5.3%, a difference of 0.090%), Arab (5.3%, a difference of 0.11%), and Immigrants from Thailand (5.3%, a difference of 0.12%).
| Demographics | Rating | Rank | Unemployment |
| Albanians | 43.5 /100 | #181 | Average 5.3% |
| Spaniards | 42.2 /100 | #182 | Average 5.3% |
| Brazilians | 40.2 /100 | #183 | Average 5.3% |
| Assyrians/Chaldeans/Syriacs | 39.2 /100 | #184 | Fair 5.3% |
| Immigrants | Thailand | 38.9 /100 | #185 | Fair 5.3% |
| Immigrants | Uganda | 37.8 /100 | #186 | Fair 5.3% |
| Costa Ricans | 37.4 /100 | #187 | Fair 5.3% |
| Alsatians | 37.0 /100 | #188 | Fair 5.3% |
| Immigrants | Belarus | 35.6 /100 | #189 | Fair 5.3% |
| Arabs | 35.3 /100 | #190 | Fair 5.3% |
| Somalis | 34.0 /100 | #191 | Fair 5.3% |
| South Americans | 33.9 /100 | #192 | Fair 5.3% |
| Immigrants | Somalia | 33.8 /100 | #193 | Fair 5.3% |
| Immigrants | Laos | 30.9 /100 | #194 | Fair 5.3% |
| Immigrants | Southern Europe | 30.9 /100 | #195 | Fair 5.3% |