Scandinavian vs Immigrants from Bahamas Unemployment
COMPARE
Scandinavian
Immigrants from Bahamas
Unemployment
Unemployment Comparison
Scandinavians
Immigrants from Bahamas
4.5%
UNEMPLOYMENT
100.0/ 100
METRIC RATING
9th/ 347
METRIC RANK
5.8%
UNEMPLOYMENT
0.1/ 100
METRIC RATING
258th/ 347
METRIC RANK
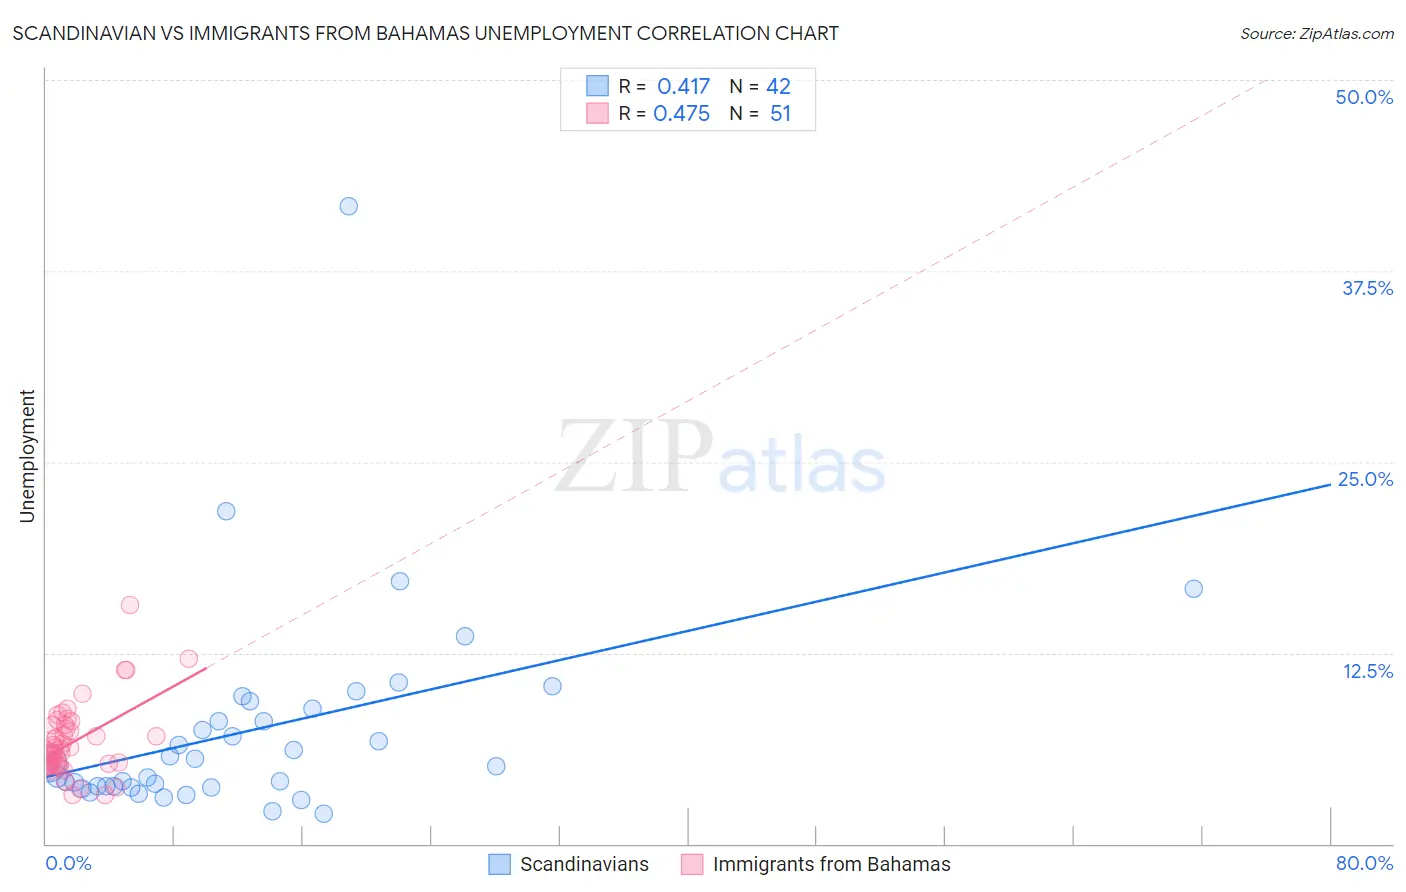
Scandinavian vs Immigrants from Bahamas Unemployment Correlation Chart
The statistical analysis conducted on geographies consisting of 471,134,185 people shows a moderate positive correlation between the proportion of Scandinavians and unemployment in the United States with a correlation coefficient (R) of 0.417 and weighted average of 4.5%. Similarly, the statistical analysis conducted on geographies consisting of 104,648,051 people shows a moderate positive correlation between the proportion of Immigrants from Bahamas and unemployment in the United States with a correlation coefficient (R) of 0.475 and weighted average of 5.8%, a difference of 27.2%.
Unemployment Correlation Summary
| Measurement | Scandinavian | Immigrants from Bahamas |
| Minimum | 2.0% | 3.2% |
| Maximum | 41.7% | 15.6% |
| Range | 39.7% | 12.4% |
| Mean | 7.4% | 6.6% |
| Median | 5.2% | 6.0% |
| Interquartile 25% (IQ1) | 3.7% | 5.2% |
| Interquartile 75% (IQ3) | 8.8% | 7.8% |
| Interquartile Range (IQR) | 5.1% | 2.6% |
| Standard Deviation (Sample) | 6.9% | 2.3% |
| Standard Deviation (Population) | 6.8% | 2.3% |
Similar Demographics by Unemployment
Demographics Similar to Scandinavians by Unemployment
In terms of unemployment, the demographic groups most similar to Scandinavians are Swiss (4.5%, a difference of 0.39%), Dutch (4.6%, a difference of 0.51%), Immigrants from India (4.5%, a difference of 0.86%), English (4.6%, a difference of 1.2%), and Pennsylvania German (4.6%, a difference of 1.3%).
| Demographics | Rating | Rank | Unemployment |
| Luxembourgers | 100.0 /100 | #2 | Exceptional 4.3% |
| Czechs | 100.0 /100 | #3 | Exceptional 4.3% |
| Danes | 100.0 /100 | #4 | Exceptional 4.3% |
| Swedes | 100.0 /100 | #5 | Exceptional 4.4% |
| Germans | 100.0 /100 | #6 | Exceptional 4.5% |
| Immigrants | India | 100.0 /100 | #7 | Exceptional 4.5% |
| Swiss | 100.0 /100 | #8 | Exceptional 4.5% |
| Scandinavians | 100.0 /100 | #9 | Exceptional 4.5% |
| Dutch | 100.0 /100 | #10 | Exceptional 4.6% |
| English | 100.0 /100 | #11 | Exceptional 4.6% |
| Pennsylvania Germans | 100.0 /100 | #12 | Exceptional 4.6% |
| Belgians | 100.0 /100 | #13 | Exceptional 4.6% |
| Immigrants | Cuba | 100.0 /100 | #14 | Exceptional 4.6% |
| Europeans | 99.9 /100 | #15 | Exceptional 4.6% |
| Chinese | 99.9 /100 | #16 | Exceptional 4.7% |
Demographics Similar to Immigrants from Bahamas by Unemployment
In terms of unemployment, the demographic groups most similar to Immigrants from Bahamas are Subsaharan African (5.8%, a difference of 0.12%), Yaqui (5.8%, a difference of 0.14%), Immigrants from Uzbekistan (5.8%, a difference of 0.14%), Immigrants from Guatemala (5.8%, a difference of 0.16%), and Sierra Leonean (5.8%, a difference of 0.26%).
| Demographics | Rating | Rank | Unemployment |
| Kiowa | 0.6 /100 | #251 | Tragic 5.7% |
| Hondurans | 0.3 /100 | #252 | Tragic 5.7% |
| Central Americans | 0.3 /100 | #253 | Tragic 5.7% |
| Immigrants | Honduras | 0.3 /100 | #254 | Tragic 5.7% |
| Immigrants | Portugal | 0.2 /100 | #255 | Tragic 5.7% |
| Guatemalans | 0.2 /100 | #256 | Tragic 5.8% |
| Yaqui | 0.2 /100 | #257 | Tragic 5.8% |
| Immigrants | Bahamas | 0.1 /100 | #258 | Tragic 5.8% |
| Sub-Saharan Africans | 0.1 /100 | #259 | Tragic 5.8% |
| Immigrants | Uzbekistan | 0.1 /100 | #260 | Tragic 5.8% |
| Immigrants | Guatemala | 0.1 /100 | #261 | Tragic 5.8% |
| Sierra Leoneans | 0.1 /100 | #262 | Tragic 5.8% |
| Salvadorans | 0.1 /100 | #263 | Tragic 5.8% |
| Immigrants | Liberia | 0.1 /100 | #264 | Tragic 5.8% |
| Nigerians | 0.1 /100 | #265 | Tragic 5.8% |