Immigrants from El Salvador vs Immigrants from Bulgaria Unemployment
COMPARE
Immigrants from El Salvador
Immigrants from Bulgaria
Unemployment
Unemployment Comparison
Immigrants from El Salvador
Immigrants from Bulgaria
5.8%
UNEMPLOYMENT
0.1/ 100
METRIC RATING
269th/ 347
METRIC RANK
4.9%
UNEMPLOYMENT
98.9/ 100
METRIC RATING
63rd/ 347
METRIC RANK
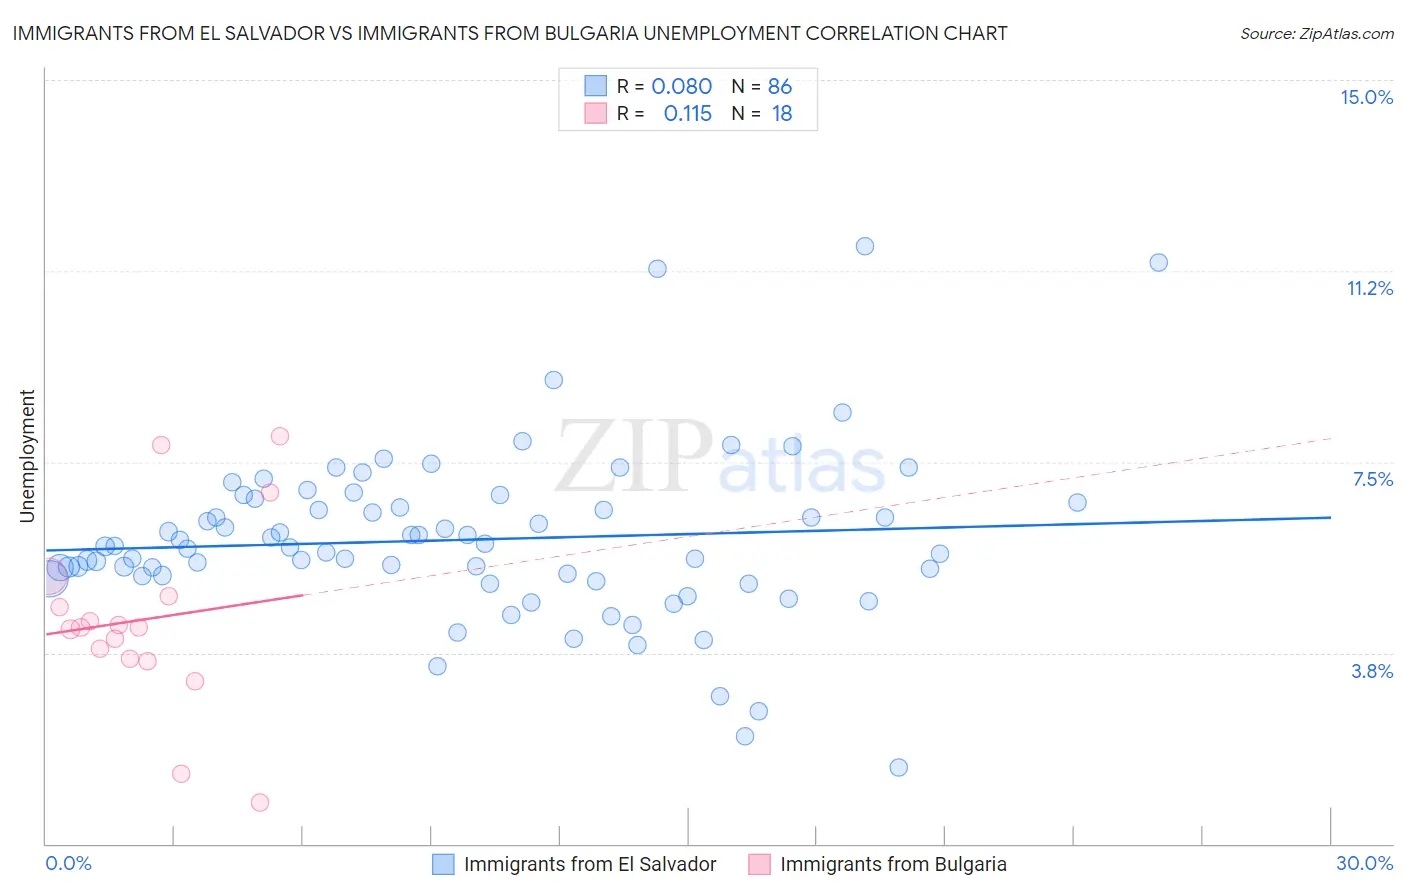
Immigrants from El Salvador vs Immigrants from Bulgaria Unemployment Correlation Chart
The statistical analysis conducted on geographies consisting of 357,477,552 people shows a slight positive correlation between the proportion of Immigrants from El Salvador and unemployment in the United States with a correlation coefficient (R) of 0.080 and weighted average of 5.8%. Similarly, the statistical analysis conducted on geographies consisting of 172,511,279 people shows a poor positive correlation between the proportion of Immigrants from Bulgaria and unemployment in the United States with a correlation coefficient (R) of 0.115 and weighted average of 4.9%, a difference of 19.4%.
Unemployment Correlation Summary
| Measurement | Immigrants from El Salvador | Immigrants from Bulgaria |
| Minimum | 1.5% | 0.80% |
| Maximum | 11.7% | 8.0% |
| Range | 10.2% | 7.2% |
| Mean | 6.0% | 4.4% |
| Median | 5.8% | 4.2% |
| Interquartile 25% (IQ1) | 5.3% | 3.6% |
| Interquartile 75% (IQ3) | 6.7% | 4.9% |
| Interquartile Range (IQR) | 1.4% | 1.2% |
| Standard Deviation (Sample) | 1.7% | 1.8% |
| Standard Deviation (Population) | 1.7% | 1.8% |
Similar Demographics by Unemployment
Demographics Similar to Immigrants from El Salvador by Unemployment
In terms of unemployment, the demographic groups most similar to Immigrants from El Salvador are Immigrants from Sierra Leone (5.8%, a difference of 0.010%), Immigrants from Nigeria (5.8%, a difference of 0.050%), Blackfeet (5.8%, a difference of 0.080%), Mexican American Indian (5.8%, a difference of 0.12%), and Mexican (5.9%, a difference of 0.31%).
| Demographics | Rating | Rank | Unemployment |
| Sierra Leoneans | 0.1 /100 | #262 | Tragic 5.8% |
| Salvadorans | 0.1 /100 | #263 | Tragic 5.8% |
| Immigrants | Liberia | 0.1 /100 | #264 | Tragic 5.8% |
| Nigerians | 0.1 /100 | #265 | Tragic 5.8% |
| Mexican American Indians | 0.1 /100 | #266 | Tragic 5.8% |
| Immigrants | Nigeria | 0.1 /100 | #267 | Tragic 5.8% |
| Immigrants | Sierra Leone | 0.1 /100 | #268 | Tragic 5.8% |
| Immigrants | El Salvador | 0.1 /100 | #269 | Tragic 5.8% |
| Blackfeet | 0.1 /100 | #270 | Tragic 5.8% |
| Mexicans | 0.1 /100 | #271 | Tragic 5.9% |
| Hispanics or Latinos | 0.0 /100 | #272 | Tragic 5.9% |
| Immigrants | Fiji | 0.0 /100 | #273 | Tragic 5.9% |
| Bahamians | 0.0 /100 | #274 | Tragic 5.9% |
| Immigrants | Latin America | 0.0 /100 | #275 | Tragic 5.9% |
| Immigrants | Central America | 0.0 /100 | #276 | Tragic 6.0% |
Demographics Similar to Immigrants from Bulgaria by Unemployment
In terms of unemployment, the demographic groups most similar to Immigrants from Bulgaria are Icelander (4.9%, a difference of 0.010%), Immigrants from Netherlands (4.9%, a difference of 0.030%), Cambodian (4.9%, a difference of 0.030%), Bhutanese (4.9%, a difference of 0.070%), and Italian (4.9%, a difference of 0.080%).
| Demographics | Rating | Rank | Unemployment |
| Celtics | 99.1 /100 | #56 | Exceptional 4.9% |
| Immigrants | Singapore | 99.1 /100 | #57 | Exceptional 4.9% |
| Greeks | 99.0 /100 | #58 | Exceptional 4.9% |
| Bhutanese | 99.0 /100 | #59 | Exceptional 4.9% |
| Immigrants | Netherlands | 99.0 /100 | #60 | Exceptional 4.9% |
| Cambodians | 99.0 /100 | #61 | Exceptional 4.9% |
| Icelanders | 98.9 /100 | #62 | Exceptional 4.9% |
| Immigrants | Bulgaria | 98.9 /100 | #63 | Exceptional 4.9% |
| Italians | 98.9 /100 | #64 | Exceptional 4.9% |
| Immigrants | Canada | 98.8 /100 | #65 | Exceptional 4.9% |
| Slovaks | 98.7 /100 | #66 | Exceptional 4.9% |
| New Zealanders | 98.6 /100 | #67 | Exceptional 4.9% |
| Slavs | 98.6 /100 | #68 | Exceptional 4.9% |
| Immigrants | North America | 98.5 /100 | #69 | Exceptional 4.9% |
| Serbians | 98.4 /100 | #70 | Exceptional 4.9% |