Immigrants from Czechoslovakia vs Immigrants from Bahamas Unemployment
COMPARE
Immigrants from Czechoslovakia
Immigrants from Bahamas
Unemployment
Unemployment Comparison
Immigrants from Czechoslovakia
Immigrants from Bahamas
5.0%
UNEMPLOYMENT
95.1/ 100
METRIC RATING
97th/ 347
METRIC RANK
5.8%
UNEMPLOYMENT
0.1/ 100
METRIC RATING
258th/ 347
METRIC RANK
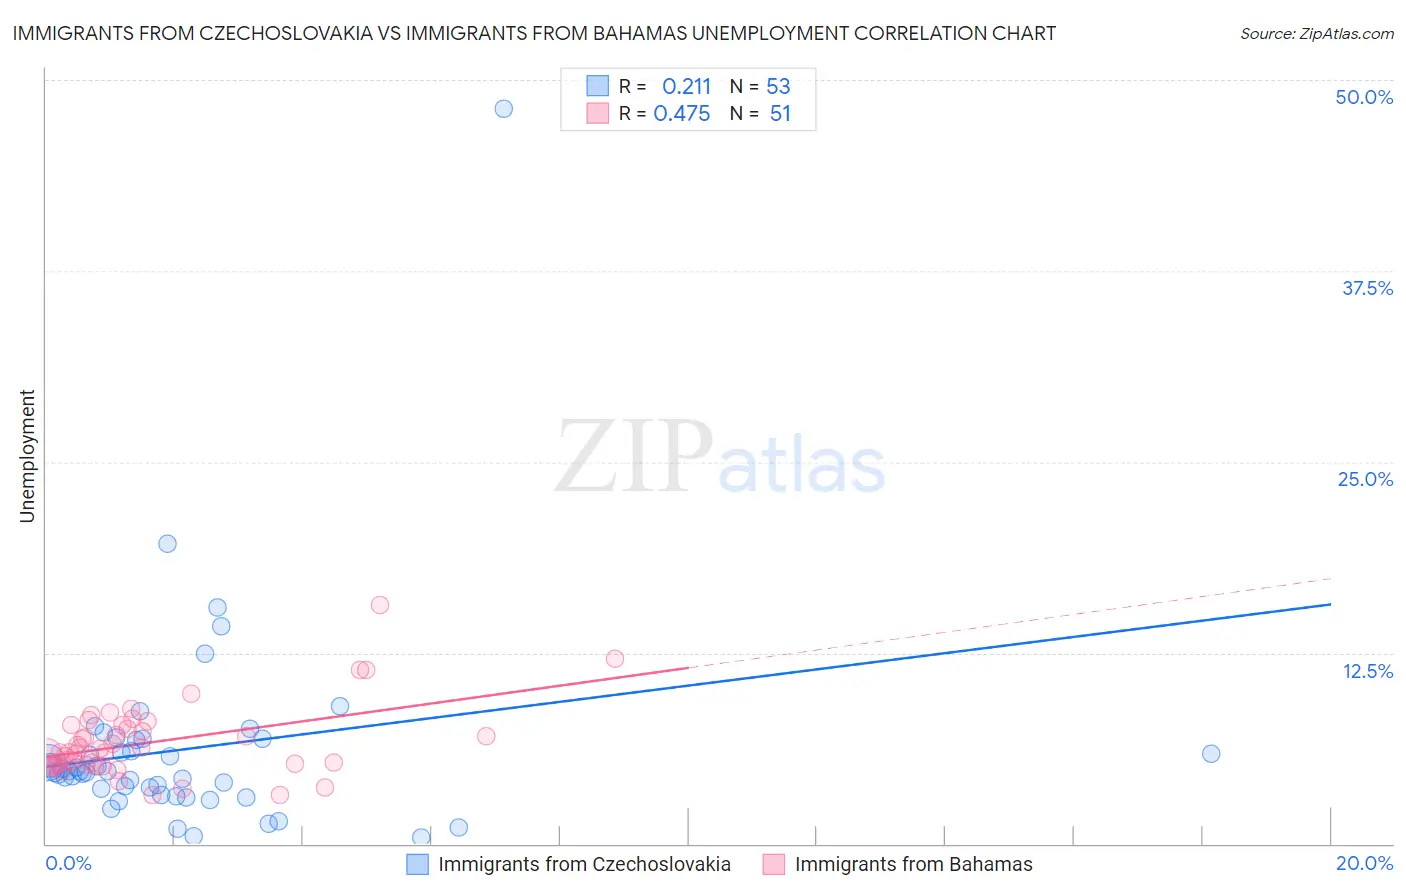
Immigrants from Czechoslovakia vs Immigrants from Bahamas Unemployment Correlation Chart
The statistical analysis conducted on geographies consisting of 195,397,412 people shows a weak positive correlation between the proportion of Immigrants from Czechoslovakia and unemployment in the United States with a correlation coefficient (R) of 0.211 and weighted average of 5.0%. Similarly, the statistical analysis conducted on geographies consisting of 104,648,051 people shows a moderate positive correlation between the proportion of Immigrants from Bahamas and unemployment in the United States with a correlation coefficient (R) of 0.475 and weighted average of 5.8%, a difference of 15.3%.
Unemployment Correlation Summary
| Measurement | Immigrants from Czechoslovakia | Immigrants from Bahamas |
| Minimum | 0.40% | 3.2% |
| Maximum | 48.1% | 15.6% |
| Range | 47.7% | 12.4% |
| Mean | 6.2% | 6.6% |
| Median | 4.7% | 6.0% |
| Interquartile 25% (IQ1) | 3.4% | 5.2% |
| Interquartile 75% (IQ3) | 6.9% | 7.8% |
| Interquartile Range (IQR) | 3.5% | 2.6% |
| Standard Deviation (Sample) | 6.9% | 2.3% |
| Standard Deviation (Population) | 6.8% | 2.3% |
Similar Demographics by Unemployment
Demographics Similar to Immigrants from Czechoslovakia by Unemployment
In terms of unemployment, the demographic groups most similar to Immigrants from Czechoslovakia are Immigrants from England (5.0%, a difference of 0.030%), Romanian (5.0%, a difference of 0.030%), Mongolian (5.0%, a difference of 0.10%), Estonian (5.0%, a difference of 0.16%), and Immigrants from Serbia (5.0%, a difference of 0.19%).
| Demographics | Rating | Rank | Unemployment |
| Immigrants | North Macedonia | 96.3 /100 | #90 | Exceptional 5.0% |
| Immigrants | Sudan | 96.3 /100 | #91 | Exceptional 5.0% |
| Immigrants | South Africa | 96.2 /100 | #92 | Exceptional 5.0% |
| Ukrainians | 96.0 /100 | #93 | Exceptional 5.0% |
| Immigrants | Austria | 95.9 /100 | #94 | Exceptional 5.0% |
| Immigrants | Serbia | 95.6 /100 | #95 | Exceptional 5.0% |
| Immigrants | England | 95.2 /100 | #96 | Exceptional 5.0% |
| Immigrants | Czechoslovakia | 95.1 /100 | #97 | Exceptional 5.0% |
| Romanians | 95.0 /100 | #98 | Exceptional 5.0% |
| Mongolians | 94.8 /100 | #99 | Exceptional 5.0% |
| Estonians | 94.6 /100 | #100 | Exceptional 5.0% |
| Americans | 94.3 /100 | #101 | Exceptional 5.0% |
| Immigrants | Argentina | 94.1 /100 | #102 | Exceptional 5.0% |
| Chickasaw | 94.0 /100 | #103 | Exceptional 5.0% |
| Osage | 94.0 /100 | #104 | Exceptional 5.0% |
Demographics Similar to Immigrants from Bahamas by Unemployment
In terms of unemployment, the demographic groups most similar to Immigrants from Bahamas are Subsaharan African (5.8%, a difference of 0.12%), Yaqui (5.8%, a difference of 0.14%), Immigrants from Uzbekistan (5.8%, a difference of 0.14%), Immigrants from Guatemala (5.8%, a difference of 0.16%), and Sierra Leonean (5.8%, a difference of 0.26%).
| Demographics | Rating | Rank | Unemployment |
| Kiowa | 0.6 /100 | #251 | Tragic 5.7% |
| Hondurans | 0.3 /100 | #252 | Tragic 5.7% |
| Central Americans | 0.3 /100 | #253 | Tragic 5.7% |
| Immigrants | Honduras | 0.3 /100 | #254 | Tragic 5.7% |
| Immigrants | Portugal | 0.2 /100 | #255 | Tragic 5.7% |
| Guatemalans | 0.2 /100 | #256 | Tragic 5.8% |
| Yaqui | 0.2 /100 | #257 | Tragic 5.8% |
| Immigrants | Bahamas | 0.1 /100 | #258 | Tragic 5.8% |
| Sub-Saharan Africans | 0.1 /100 | #259 | Tragic 5.8% |
| Immigrants | Uzbekistan | 0.1 /100 | #260 | Tragic 5.8% |
| Immigrants | Guatemala | 0.1 /100 | #261 | Tragic 5.8% |
| Sierra Leoneans | 0.1 /100 | #262 | Tragic 5.8% |
| Salvadorans | 0.1 /100 | #263 | Tragic 5.8% |
| Immigrants | Liberia | 0.1 /100 | #264 | Tragic 5.8% |
| Nigerians | 0.1 /100 | #265 | Tragic 5.8% |