Immigrants from Dominica vs Spanish American Indian Unemployment Among Women with Children Ages 6 to 17 years
COMPARE
Immigrants from Dominica
Spanish American Indian
Unemployment Among Women with Children Ages 6 to 17 years
Unemployment Among Women with Children Ages 6 to 17 years Comparison
Immigrants from Dominica
Spanish American Indians
10.5%
UNEMPLOYMENT AMONG WOMEN WITH CHILDREN AGES 6 TO 17 YEARS
0.0/ 100
METRIC RATING
316th/ 347
METRIC RANK
8.2%
UNEMPLOYMENT AMONG WOMEN WITH CHILDREN AGES 6 TO 17 YEARS
100.0/ 100
METRIC RATING
62nd/ 347
METRIC RANK
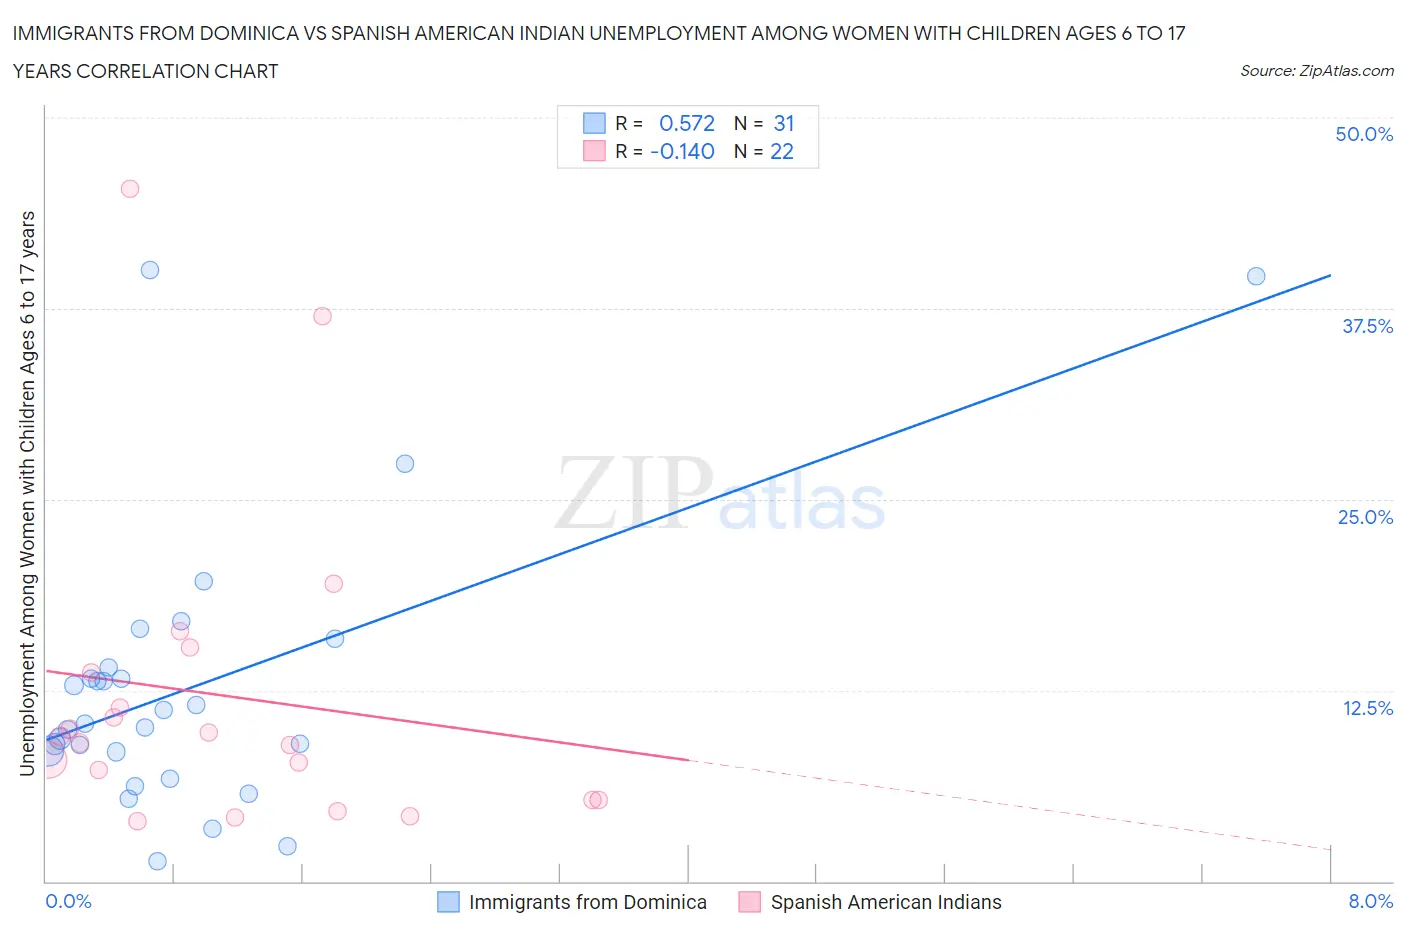
Immigrants from Dominica vs Spanish American Indian Unemployment Among Women with Children Ages 6 to 17 years Correlation Chart
The statistical analysis conducted on geographies consisting of 74,932,264 people shows a substantial positive correlation between the proportion of Immigrants from Dominica and unemployment rate among women with children between the ages 6 and 17 in the United States with a correlation coefficient (R) of 0.572 and weighted average of 10.5%. Similarly, the statistical analysis conducted on geographies consisting of 68,050,108 people shows a poor negative correlation between the proportion of Spanish American Indians and unemployment rate among women with children between the ages 6 and 17 in the United States with a correlation coefficient (R) of -0.140 and weighted average of 8.2%, a difference of 28.0%.
Unemployment Among Women with Children Ages 6 to 17 years Correlation Summary
| Measurement | Immigrants from Dominica | Spanish American Indian |
| Minimum | 1.3% | 4.0% |
| Maximum | 40.0% | 45.4% |
| Range | 38.7% | 41.4% |
| Mean | 12.7% | 12.1% |
| Median | 10.3% | 9.3% |
| Interquartile 25% (IQ1) | 8.5% | 5.3% |
| Interquartile 75% (IQ3) | 14.0% | 13.7% |
| Interquartile Range (IQR) | 5.5% | 8.4% |
| Standard Deviation (Sample) | 8.9% | 10.4% |
| Standard Deviation (Population) | 8.8% | 10.1% |
Similar Demographics by Unemployment Among Women with Children Ages 6 to 17 years
Demographics Similar to Immigrants from Dominica by Unemployment Among Women with Children Ages 6 to 17 years
In terms of unemployment among women with children ages 6 to 17 years, the demographic groups most similar to Immigrants from Dominica are Bermudan (10.5%, a difference of 0.12%), Delaware (10.5%, a difference of 0.13%), Bahamian (10.4%, a difference of 0.75%), Immigrants from Cabo Verde (10.4%, a difference of 0.78%), and American (10.4%, a difference of 0.83%).
| Demographics | Rating | Rank | Unemployment Among Women with Children Ages 6 to 17 years |
| French Canadians | 0.0 /100 | #309 | Tragic 10.3% |
| Alaska Natives | 0.0 /100 | #310 | Tragic 10.3% |
| Immigrants | Liberia | 0.0 /100 | #311 | Tragic 10.3% |
| Africans | 0.0 /100 | #312 | Tragic 10.4% |
| Americans | 0.0 /100 | #313 | Tragic 10.4% |
| Immigrants | Cabo Verde | 0.0 /100 | #314 | Tragic 10.4% |
| Bahamians | 0.0 /100 | #315 | Tragic 10.4% |
| Immigrants | Dominica | 0.0 /100 | #316 | Tragic 10.5% |
| Bermudans | 0.0 /100 | #317 | Tragic 10.5% |
| Delaware | 0.0 /100 | #318 | Tragic 10.5% |
| Immigrants | Uganda | 0.0 /100 | #319 | Tragic 10.7% |
| Apache | 0.0 /100 | #320 | Tragic 10.7% |
| Tohono O'odham | 0.0 /100 | #321 | Tragic 10.7% |
| Cree | 0.0 /100 | #322 | Tragic 10.8% |
| Dominicans | 0.0 /100 | #323 | Tragic 10.8% |
Demographics Similar to Spanish American Indians by Unemployment Among Women with Children Ages 6 to 17 years
In terms of unemployment among women with children ages 6 to 17 years, the demographic groups most similar to Spanish American Indians are Korean (8.2%, a difference of 0.030%), Immigrants from Philippines (8.2%, a difference of 0.22%), Basque (8.2%, a difference of 0.22%), Immigrants from Malaysia (8.2%, a difference of 0.28%), and Immigrants from South Eastern Asia (8.2%, a difference of 0.40%).
| Demographics | Rating | Rank | Unemployment Among Women with Children Ages 6 to 17 years |
| Immigrants | Japan | 100.0 /100 | #55 | Exceptional 8.2% |
| Immigrants | Bosnia and Herzegovina | 100.0 /100 | #56 | Exceptional 8.2% |
| Immigrants | Laos | 100.0 /100 | #57 | Exceptional 8.2% |
| Immigrants | Malaysia | 100.0 /100 | #58 | Exceptional 8.2% |
| Immigrants | Philippines | 100.0 /100 | #59 | Exceptional 8.2% |
| Basques | 100.0 /100 | #60 | Exceptional 8.2% |
| Koreans | 100.0 /100 | #61 | Exceptional 8.2% |
| Spanish American Indians | 100.0 /100 | #62 | Exceptional 8.2% |
| Immigrants | South Eastern Asia | 99.9 /100 | #63 | Exceptional 8.2% |
| Immigrants | Kuwait | 99.9 /100 | #64 | Exceptional 8.3% |
| Immigrants | Albania | 99.9 /100 | #65 | Exceptional 8.3% |
| Luxembourgers | 99.9 /100 | #66 | Exceptional 8.3% |
| Armenians | 99.9 /100 | #67 | Exceptional 8.3% |
| Marshallese | 99.9 /100 | #68 | Exceptional 8.3% |
| Immigrants | Thailand | 99.9 /100 | #69 | Exceptional 8.3% |