Yaqui vs Spanish American Indian Unemployment Among Women with Children Ages 6 to 17 years
COMPARE
Yaqui
Spanish American Indian
Unemployment Among Women with Children Ages 6 to 17 years
Unemployment Among Women with Children Ages 6 to 17 years Comparison
Yaqui
Spanish American Indians
8.7%
UNEMPLOYMENT AMONG WOMEN WITH CHILDREN AGES 6 TO 17 YEARS
92.2/ 100
METRIC RATING
132nd/ 347
METRIC RANK
8.2%
UNEMPLOYMENT AMONG WOMEN WITH CHILDREN AGES 6 TO 17 YEARS
100.0/ 100
METRIC RATING
62nd/ 347
METRIC RANK
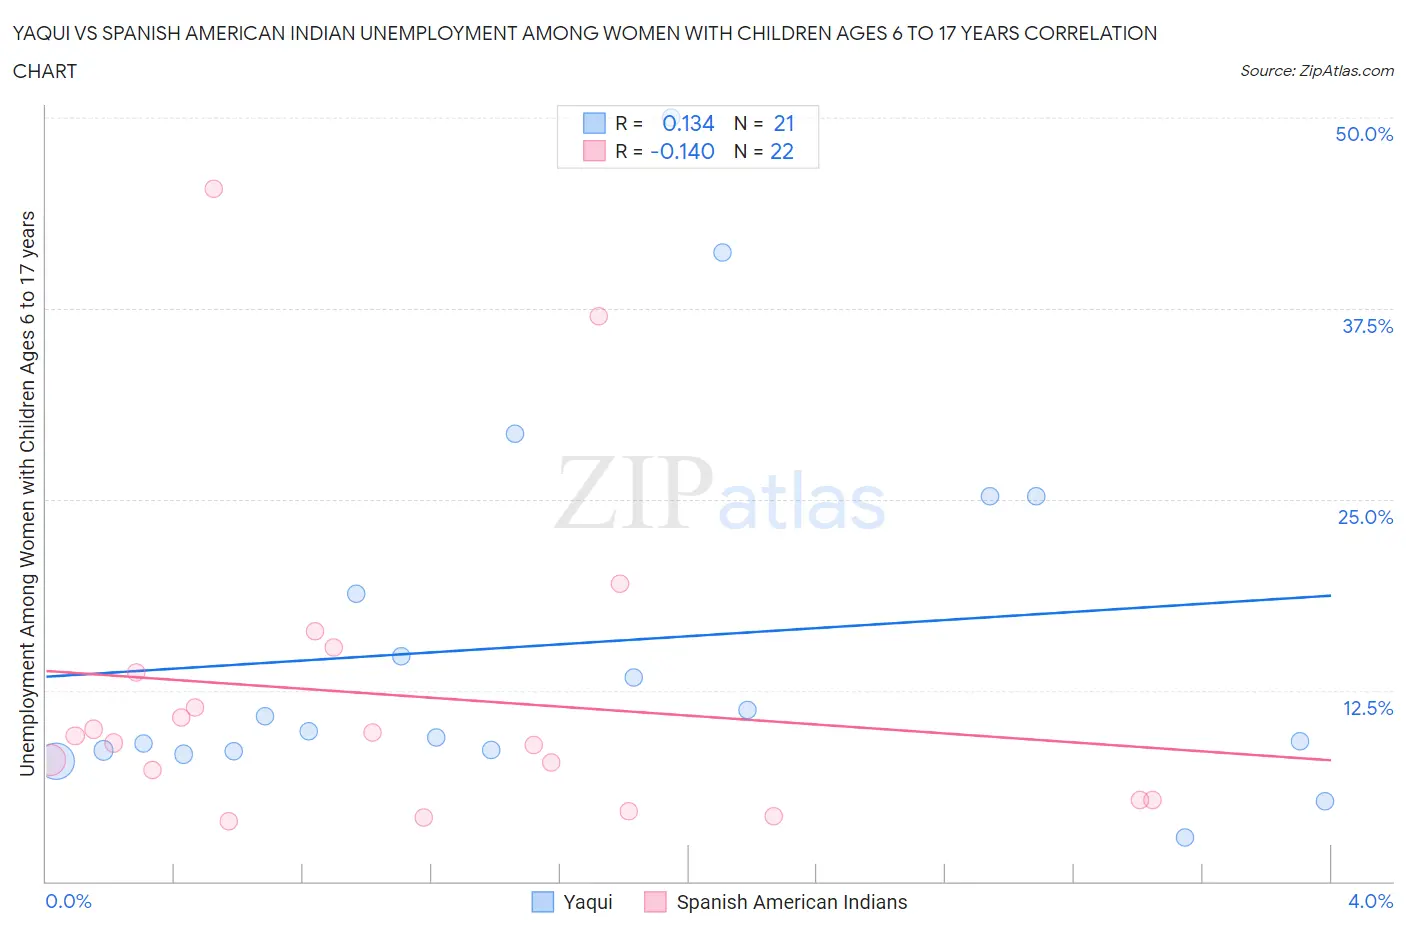
Yaqui vs Spanish American Indian Unemployment Among Women with Children Ages 6 to 17 years Correlation Chart
The statistical analysis conducted on geographies consisting of 95,121,175 people shows a poor positive correlation between the proportion of Yaqui and unemployment rate among women with children between the ages 6 and 17 in the United States with a correlation coefficient (R) of 0.134 and weighted average of 8.7%. Similarly, the statistical analysis conducted on geographies consisting of 68,050,108 people shows a poor negative correlation between the proportion of Spanish American Indians and unemployment rate among women with children between the ages 6 and 17 in the United States with a correlation coefficient (R) of -0.140 and weighted average of 8.2%, a difference of 6.3%.
Unemployment Among Women with Children Ages 6 to 17 years Correlation Summary
| Measurement | Yaqui | Spanish American Indian |
| Minimum | 2.9% | 4.0% |
| Maximum | 50.0% | 45.4% |
| Range | 47.1% | 41.4% |
| Mean | 15.6% | 12.1% |
| Median | 9.8% | 9.3% |
| Interquartile 25% (IQ1) | 8.5% | 5.3% |
| Interquartile 75% (IQ3) | 22.0% | 13.7% |
| Interquartile Range (IQR) | 13.5% | 8.4% |
| Standard Deviation (Sample) | 12.2% | 10.4% |
| Standard Deviation (Population) | 11.9% | 10.1% |
Similar Demographics by Unemployment Among Women with Children Ages 6 to 17 years
Demographics Similar to Yaqui by Unemployment Among Women with Children Ages 6 to 17 years
In terms of unemployment among women with children ages 6 to 17 years, the demographic groups most similar to Yaqui are Slavic (8.7%, a difference of 0.010%), Egyptian (8.7%, a difference of 0.060%), Immigrants from Western Asia (8.7%, a difference of 0.16%), Immigrants from Ireland (8.7%, a difference of 0.17%), and European (8.7%, a difference of 0.23%).
| Demographics | Rating | Rank | Unemployment Among Women with Children Ages 6 to 17 years |
| South Africans | 94.6 /100 | #125 | Exceptional 8.7% |
| Immigrants | Northern Africa | 94.4 /100 | #126 | Exceptional 8.7% |
| Czechs | 94.4 /100 | #127 | Exceptional 8.7% |
| Hmong | 94.3 /100 | #128 | Exceptional 8.7% |
| Barbadians | 93.8 /100 | #129 | Exceptional 8.7% |
| Immigrants | Western Asia | 93.1 /100 | #130 | Exceptional 8.7% |
| Slavs | 92.2 /100 | #131 | Exceptional 8.7% |
| Yaqui | 92.2 /100 | #132 | Exceptional 8.7% |
| Egyptians | 91.8 /100 | #133 | Exceptional 8.7% |
| Immigrants | Ireland | 91.0 /100 | #134 | Exceptional 8.7% |
| Europeans | 90.6 /100 | #135 | Exceptional 8.7% |
| Immigrants | Latvia | 90.4 /100 | #136 | Exceptional 8.7% |
| Immigrants | Argentina | 90.0 /100 | #137 | Excellent 8.7% |
| Immigrants | Ethiopia | 89.5 /100 | #138 | Excellent 8.8% |
| Northern Europeans | 89.2 /100 | #139 | Excellent 8.8% |
Demographics Similar to Spanish American Indians by Unemployment Among Women with Children Ages 6 to 17 years
In terms of unemployment among women with children ages 6 to 17 years, the demographic groups most similar to Spanish American Indians are Korean (8.2%, a difference of 0.030%), Immigrants from Philippines (8.2%, a difference of 0.22%), Basque (8.2%, a difference of 0.22%), Immigrants from Malaysia (8.2%, a difference of 0.28%), and Immigrants from South Eastern Asia (8.2%, a difference of 0.40%).
| Demographics | Rating | Rank | Unemployment Among Women with Children Ages 6 to 17 years |
| Immigrants | Japan | 100.0 /100 | #55 | Exceptional 8.2% |
| Immigrants | Bosnia and Herzegovina | 100.0 /100 | #56 | Exceptional 8.2% |
| Immigrants | Laos | 100.0 /100 | #57 | Exceptional 8.2% |
| Immigrants | Malaysia | 100.0 /100 | #58 | Exceptional 8.2% |
| Immigrants | Philippines | 100.0 /100 | #59 | Exceptional 8.2% |
| Basques | 100.0 /100 | #60 | Exceptional 8.2% |
| Koreans | 100.0 /100 | #61 | Exceptional 8.2% |
| Spanish American Indians | 100.0 /100 | #62 | Exceptional 8.2% |
| Immigrants | South Eastern Asia | 99.9 /100 | #63 | Exceptional 8.2% |
| Immigrants | Kuwait | 99.9 /100 | #64 | Exceptional 8.3% |
| Immigrants | Albania | 99.9 /100 | #65 | Exceptional 8.3% |
| Luxembourgers | 99.9 /100 | #66 | Exceptional 8.3% |
| Armenians | 99.9 /100 | #67 | Exceptional 8.3% |
| Marshallese | 99.9 /100 | #68 | Exceptional 8.3% |
| Immigrants | Thailand | 99.9 /100 | #69 | Exceptional 8.3% |