Samoan vs Hmong Unemployment Among Women with Children Ages 6 to 17 years
COMPARE
Samoan
Hmong
Unemployment Among Women with Children Ages 6 to 17 years
Unemployment Among Women with Children Ages 6 to 17 years Comparison
Samoans
Hmong
8.4%
UNEMPLOYMENT AMONG WOMEN WITH CHILDREN AGES 6 TO 17 YEARS
99.7/ 100
METRIC RATING
74th/ 347
METRIC RANK
8.7%
UNEMPLOYMENT AMONG WOMEN WITH CHILDREN AGES 6 TO 17 YEARS
94.3/ 100
METRIC RATING
128th/ 347
METRIC RANK
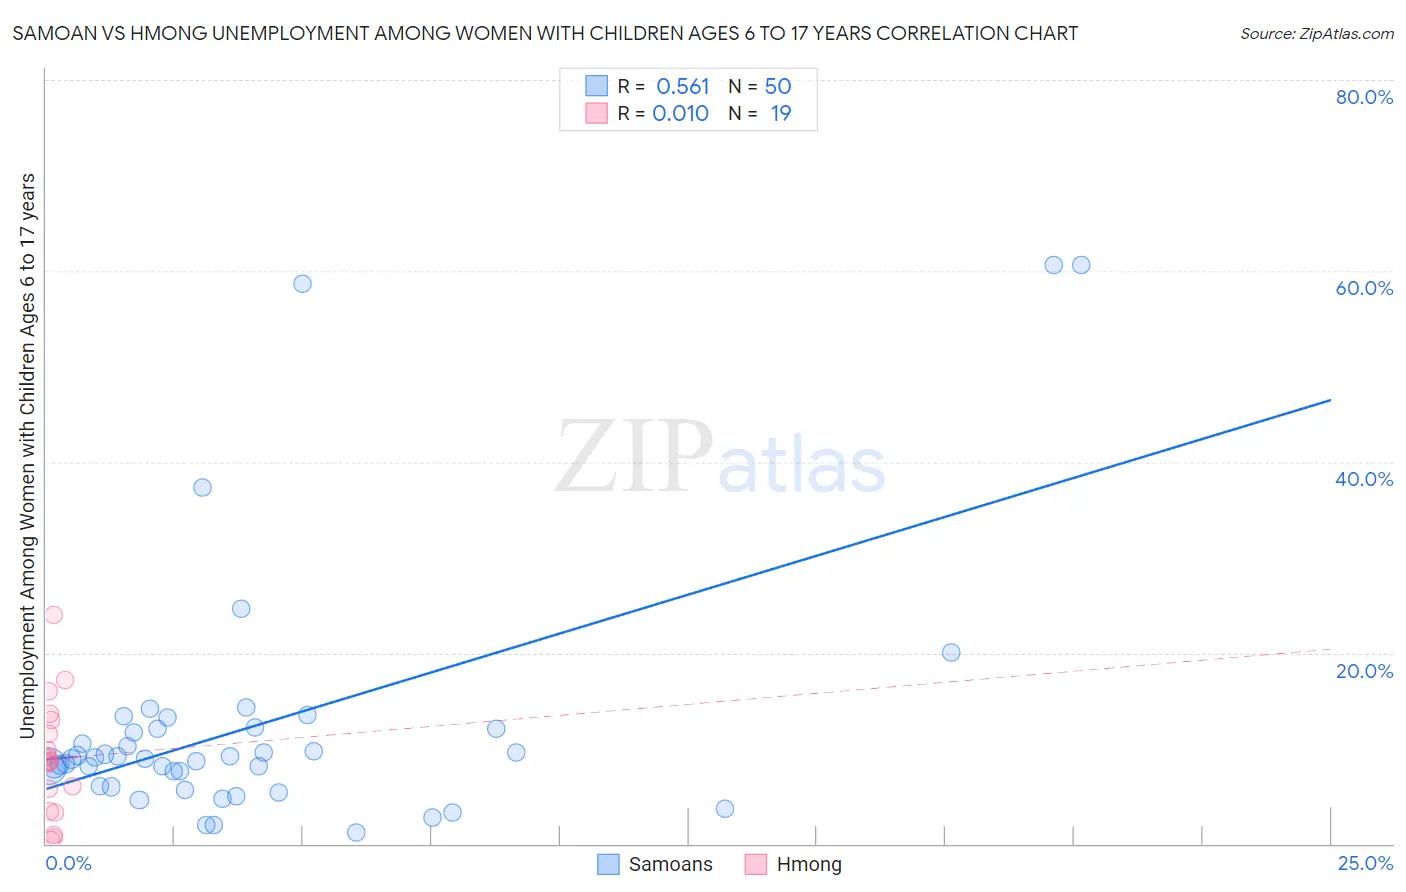
Samoan vs Hmong Unemployment Among Women with Children Ages 6 to 17 years Correlation Chart
The statistical analysis conducted on geographies consisting of 183,981,110 people shows a substantial positive correlation between the proportion of Samoans and unemployment rate among women with children between the ages 6 and 17 in the United States with a correlation coefficient (R) of 0.561 and weighted average of 8.4%. Similarly, the statistical analysis conducted on geographies consisting of 23,659,268 people shows no correlation between the proportion of Hmong and unemployment rate among women with children between the ages 6 and 17 in the United States with a correlation coefficient (R) of 0.010 and weighted average of 8.7%, a difference of 3.6%.
Unemployment Among Women with Children Ages 6 to 17 years Correlation Summary
| Measurement | Samoan | Hmong |
| Minimum | 1.2% | 0.40% |
| Maximum | 60.6% | 24.0% |
| Range | 59.4% | 23.6% |
| Mean | 12.5% | 8.9% |
| Median | 9.0% | 8.6% |
| Interquartile 25% (IQ1) | 6.0% | 3.4% |
| Interquartile 75% (IQ3) | 12.0% | 13.0% |
| Interquartile Range (IQR) | 6.0% | 9.6% |
| Standard Deviation (Sample) | 13.5% | 6.1% |
| Standard Deviation (Population) | 13.3% | 6.0% |
Similar Demographics by Unemployment Among Women with Children Ages 6 to 17 years
Demographics Similar to Samoans by Unemployment Among Women with Children Ages 6 to 17 years
In terms of unemployment among women with children ages 6 to 17 years, the demographic groups most similar to Samoans are Immigrants from Sri Lanka (8.4%, a difference of 0.080%), Immigrants from Moldova (8.4%, a difference of 0.11%), Iraqi (8.4%, a difference of 0.16%), Pakistani (8.4%, a difference of 0.29%), and Mongolian (8.4%, a difference of 0.30%).
| Demographics | Rating | Rank | Unemployment Among Women with Children Ages 6 to 17 years |
| Armenians | 99.9 /100 | #67 | Exceptional 8.3% |
| Marshallese | 99.9 /100 | #68 | Exceptional 8.3% |
| Immigrants | Thailand | 99.9 /100 | #69 | Exceptional 8.3% |
| Norwegians | 99.9 /100 | #70 | Exceptional 8.3% |
| Immigrants | Australia | 99.8 /100 | #71 | Exceptional 8.3% |
| Immigrants | Nepal | 99.8 /100 | #72 | Exceptional 8.3% |
| Spanish Americans | 99.8 /100 | #73 | Exceptional 8.4% |
| Samoans | 99.7 /100 | #74 | Exceptional 8.4% |
| Immigrants | Sri Lanka | 99.7 /100 | #75 | Exceptional 8.4% |
| Immigrants | Moldova | 99.7 /100 | #76 | Exceptional 8.4% |
| Iraqis | 99.7 /100 | #77 | Exceptional 8.4% |
| Pakistanis | 99.6 /100 | #78 | Exceptional 8.4% |
| Mongolians | 99.6 /100 | #79 | Exceptional 8.4% |
| Immigrants | Belarus | 99.6 /100 | #80 | Exceptional 8.4% |
| Immigrants | Bolivia | 99.6 /100 | #81 | Exceptional 8.4% |
Demographics Similar to Hmong by Unemployment Among Women with Children Ages 6 to 17 years
In terms of unemployment among women with children ages 6 to 17 years, the demographic groups most similar to Hmong are Czech (8.7%, a difference of 0.020%), Immigrants from Northern Africa (8.7%, a difference of 0.030%), South African (8.7%, a difference of 0.050%), Barbadian (8.7%, a difference of 0.10%), and Immigrants from Morocco (8.7%, a difference of 0.12%).
| Demographics | Rating | Rank | Unemployment Among Women with Children Ages 6 to 17 years |
| Immigrants | Denmark | 95.5 /100 | #121 | Exceptional 8.7% |
| Immigrants | Egypt | 95.0 /100 | #122 | Exceptional 8.7% |
| Immigrants | Morocco | 94.9 /100 | #123 | Exceptional 8.7% |
| Immigrants | Lebanon | 94.9 /100 | #124 | Exceptional 8.7% |
| South Africans | 94.6 /100 | #125 | Exceptional 8.7% |
| Immigrants | Northern Africa | 94.4 /100 | #126 | Exceptional 8.7% |
| Czechs | 94.4 /100 | #127 | Exceptional 8.7% |
| Hmong | 94.3 /100 | #128 | Exceptional 8.7% |
| Barbadians | 93.8 /100 | #129 | Exceptional 8.7% |
| Immigrants | Western Asia | 93.1 /100 | #130 | Exceptional 8.7% |
| Slavs | 92.2 /100 | #131 | Exceptional 8.7% |
| Yaqui | 92.2 /100 | #132 | Exceptional 8.7% |
| Egyptians | 91.8 /100 | #133 | Exceptional 8.7% |
| Immigrants | Ireland | 91.0 /100 | #134 | Exceptional 8.7% |
| Europeans | 90.6 /100 | #135 | Exceptional 8.7% |