Samoan vs Slovene Unemployment
COMPARE
Samoan
Slovene
Unemployment
Unemployment Comparison
Samoans
Slovenes
5.5%
UNEMPLOYMENT
7.1/ 100
METRIC RATING
226th/ 347
METRIC RANK
4.7%
UNEMPLOYMENT
99.9/ 100
METRIC RATING
17th/ 347
METRIC RANK
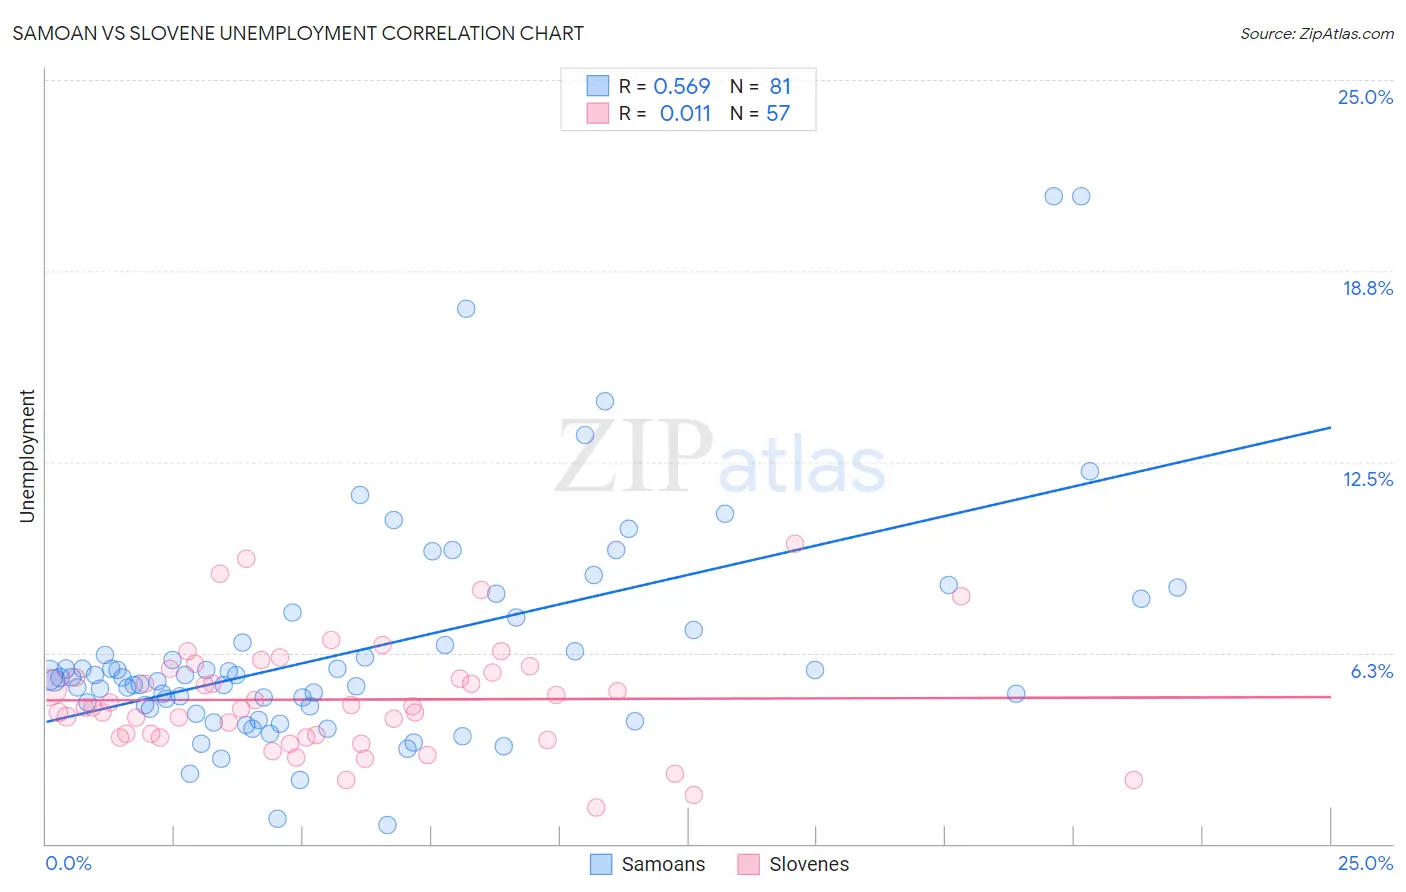
Samoan vs Slovene Unemployment Correlation Chart
The statistical analysis conducted on geographies consisting of 225,021,863 people shows a substantial positive correlation between the proportion of Samoans and unemployment in the United States with a correlation coefficient (R) of 0.569 and weighted average of 5.5%. Similarly, the statistical analysis conducted on geographies consisting of 261,132,264 people shows no correlation between the proportion of Slovenes and unemployment in the United States with a correlation coefficient (R) of 0.011 and weighted average of 4.7%, a difference of 17.3%.
Unemployment Correlation Summary
| Measurement | Samoan | Slovene |
| Minimum | 0.60% | 1.2% |
| Maximum | 21.2% | 9.8% |
| Range | 20.6% | 8.6% |
| Mean | 6.4% | 4.7% |
| Median | 5.4% | 4.5% |
| Interquartile 25% (IQ1) | 4.5% | 3.5% |
| Interquartile 75% (IQ3) | 7.2% | 5.7% |
| Interquartile Range (IQR) | 2.7% | 2.2% |
| Standard Deviation (Sample) | 3.7% | 1.8% |
| Standard Deviation (Population) | 3.7% | 1.8% |
Similar Demographics by Unemployment
Demographics Similar to Samoans by Unemployment
In terms of unemployment, the demographic groups most similar to Samoans are Immigrants from Lebanon (5.5%, a difference of 0.030%), South American Indian (5.5%, a difference of 0.15%), Guamanian/Chamorro (5.5%, a difference of 0.18%), Israeli (5.4%, a difference of 0.35%), and Seminole (5.4%, a difference of 0.42%).
| Demographics | Rating | Rank | Unemployment |
| Bangladeshis | 11.2 /100 | #219 | Poor 5.4% |
| Soviet Union | 10.6 /100 | #220 | Poor 5.4% |
| Immigrants | Philippines | 10.4 /100 | #221 | Poor 5.4% |
| Iroquois | 10.3 /100 | #222 | Poor 5.4% |
| Seminole | 9.2 /100 | #223 | Tragic 5.4% |
| Israelis | 8.8 /100 | #224 | Tragic 5.4% |
| South American Indians | 7.8 /100 | #225 | Tragic 5.5% |
| Samoans | 7.1 /100 | #226 | Tragic 5.5% |
| Immigrants | Lebanon | 7.0 /100 | #227 | Tragic 5.5% |
| Guamanians/Chamorros | 6.3 /100 | #228 | Tragic 5.5% |
| Hawaiians | 5.4 /100 | #229 | Tragic 5.5% |
| Ottawa | 5.4 /100 | #230 | Tragic 5.5% |
| Immigrants | Africa | 4.9 /100 | #231 | Tragic 5.5% |
| Comanche | 4.9 /100 | #232 | Tragic 5.5% |
| Immigrants | Syria | 4.8 /100 | #233 | Tragic 5.5% |
Demographics Similar to Slovenes by Unemployment
In terms of unemployment, the demographic groups most similar to Slovenes are Immigrants from Venezuela (4.7%, a difference of 0.020%), Chinese (4.7%, a difference of 0.10%), Scottish (4.7%, a difference of 0.10%), European (4.6%, a difference of 0.24%), and Carpatho Rusyn (4.7%, a difference of 0.69%).
| Demographics | Rating | Rank | Unemployment |
| Dutch | 100.0 /100 | #10 | Exceptional 4.6% |
| English | 100.0 /100 | #11 | Exceptional 4.6% |
| Pennsylvania Germans | 100.0 /100 | #12 | Exceptional 4.6% |
| Belgians | 100.0 /100 | #13 | Exceptional 4.6% |
| Immigrants | Cuba | 100.0 /100 | #14 | Exceptional 4.6% |
| Europeans | 99.9 /100 | #15 | Exceptional 4.6% |
| Chinese | 99.9 /100 | #16 | Exceptional 4.7% |
| Slovenes | 99.9 /100 | #17 | Exceptional 4.7% |
| Immigrants | Venezuela | 99.9 /100 | #18 | Exceptional 4.7% |
| Scottish | 99.9 /100 | #19 | Exceptional 4.7% |
| Carpatho Rusyns | 99.9 /100 | #20 | Exceptional 4.7% |
| Welsh | 99.9 /100 | #21 | Exceptional 4.7% |
| Thais | 99.9 /100 | #22 | Exceptional 4.7% |
| British | 99.9 /100 | #23 | Exceptional 4.7% |
| Venezuelans | 99.9 /100 | #24 | Exceptional 4.7% |