Immigrants from Czechoslovakia vs Immigrants from Ecuador Female Unemployment
COMPARE
Immigrants from Czechoslovakia
Immigrants from Ecuador
Female Unemployment
Female Unemployment Comparison
Immigrants from Czechoslovakia
Immigrants from Ecuador
5.0%
FEMALE UNEMPLOYMENT
95.0/ 100
METRIC RATING
101st/ 347
METRIC RANK
6.4%
FEMALE UNEMPLOYMENT
0.0/ 100
METRIC RATING
314th/ 347
METRIC RANK
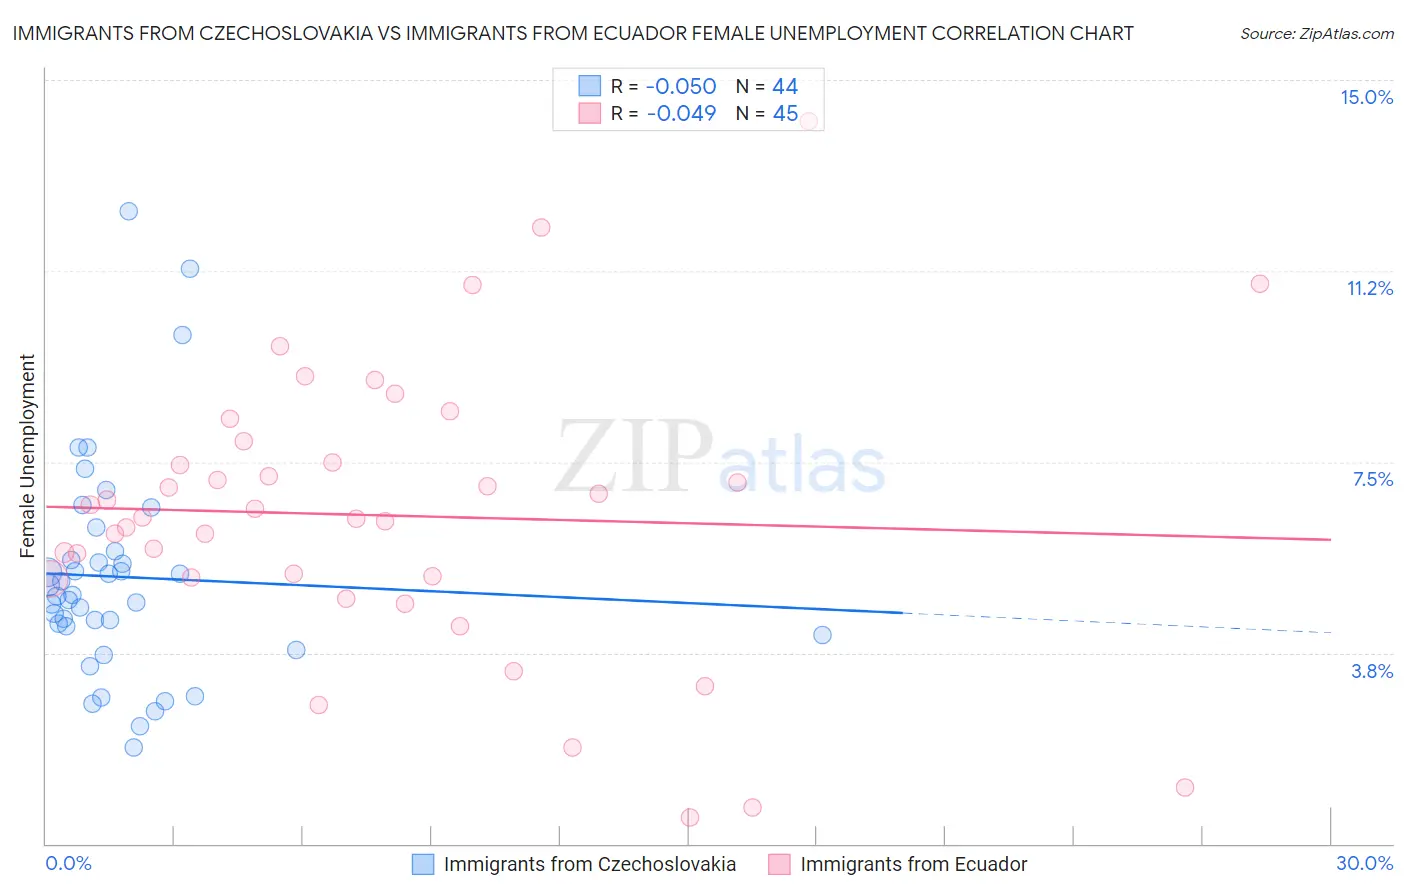
Immigrants from Czechoslovakia vs Immigrants from Ecuador Female Unemployment Correlation Chart
The statistical analysis conducted on geographies consisting of 195,172,474 people shows no correlation between the proportion of Immigrants from Czechoslovakia and unemploymnet rate among females in the United States with a correlation coefficient (R) of -0.050 and weighted average of 5.0%. Similarly, the statistical analysis conducted on geographies consisting of 270,415,803 people shows no correlation between the proportion of Immigrants from Ecuador and unemploymnet rate among females in the United States with a correlation coefficient (R) of -0.049 and weighted average of 6.4%, a difference of 26.5%.
Female Unemployment Correlation Summary
| Measurement | Immigrants from Czechoslovakia | Immigrants from Ecuador |
| Minimum | 1.9% | 0.51% |
| Maximum | 12.4% | 14.2% |
| Range | 10.5% | 13.7% |
| Mean | 5.2% | 6.4% |
| Median | 4.9% | 6.4% |
| Interquartile 25% (IQ1) | 4.2% | 5.2% |
| Interquartile 75% (IQ3) | 5.6% | 7.7% |
| Interquartile Range (IQR) | 1.5% | 2.5% |
| Standard Deviation (Sample) | 2.2% | 2.8% |
| Standard Deviation (Population) | 2.1% | 2.8% |
Similar Demographics by Female Unemployment
Demographics Similar to Immigrants from Czechoslovakia by Female Unemployment
In terms of female unemployment, the demographic groups most similar to Immigrants from Czechoslovakia are Indonesian (5.0%, a difference of 0.040%), Immigrants from Kenya (5.0%, a difference of 0.050%), Immigrants from Zaire (5.0%, a difference of 0.060%), Immigrants from Somalia (5.0%, a difference of 0.070%), and Immigrants from Kuwait (5.0%, a difference of 0.070%).
| Demographics | Rating | Rank | Female Unemployment |
| Immigrants | Malaysia | 95.7 /100 | #94 | Exceptional 5.0% |
| Burmese | 95.6 /100 | #95 | Exceptional 5.0% |
| Immigrants | South Central Asia | 95.5 /100 | #96 | Exceptional 5.0% |
| Immigrants | Somalia | 95.2 /100 | #97 | Exceptional 5.0% |
| Immigrants | Kuwait | 95.2 /100 | #98 | Exceptional 5.0% |
| Immigrants | Zaire | 95.2 /100 | #99 | Exceptional 5.0% |
| Indonesians | 95.1 /100 | #100 | Exceptional 5.0% |
| Immigrants | Czechoslovakia | 95.0 /100 | #101 | Exceptional 5.0% |
| Immigrants | Kenya | 94.8 /100 | #102 | Exceptional 5.0% |
| Somalis | 94.6 /100 | #103 | Exceptional 5.0% |
| Kenyans | 93.7 /100 | #104 | Exceptional 5.0% |
| Immigrants | England | 93.6 /100 | #105 | Exceptional 5.0% |
| Paraguayans | 93.2 /100 | #106 | Exceptional 5.1% |
| Immigrants | Switzerland | 93.1 /100 | #107 | Exceptional 5.1% |
| Puget Sound Salish | 93.0 /100 | #108 | Exceptional 5.1% |
Demographics Similar to Immigrants from Ecuador by Female Unemployment
In terms of female unemployment, the demographic groups most similar to Immigrants from Ecuador are Belizean (6.3%, a difference of 0.23%), Immigrants from Grenada (6.3%, a difference of 0.24%), Pueblo (6.4%, a difference of 0.31%), Houma (6.4%, a difference of 0.60%), and Immigrants from Mexico (6.3%, a difference of 0.90%).
| Demographics | Rating | Rank | Female Unemployment |
| Shoshone | 0.0 /100 | #307 | Tragic 6.2% |
| Hispanics or Latinos | 0.0 /100 | #308 | Tragic 6.2% |
| Ecuadorians | 0.0 /100 | #309 | Tragic 6.3% |
| Central American Indians | 0.0 /100 | #310 | Tragic 6.3% |
| Immigrants | Mexico | 0.0 /100 | #311 | Tragic 6.3% |
| Immigrants | Grenada | 0.0 /100 | #312 | Tragic 6.3% |
| Belizeans | 0.0 /100 | #313 | Tragic 6.3% |
| Immigrants | Ecuador | 0.0 /100 | #314 | Tragic 6.4% |
| Pueblo | 0.0 /100 | #315 | Tragic 6.4% |
| Houma | 0.0 /100 | #316 | Tragic 6.4% |
| Immigrants | St. Vincent and the Grenadines | 0.0 /100 | #317 | Tragic 6.4% |
| British West Indians | 0.0 /100 | #318 | Tragic 6.4% |
| Immigrants | Bangladesh | 0.0 /100 | #319 | Tragic 6.5% |
| Immigrants | Dominica | 0.0 /100 | #320 | Tragic 6.5% |
| Blacks/African Americans | 0.0 /100 | #321 | Tragic 6.5% |