Potawatomi vs Greek Female Unemployment
COMPARE
Potawatomi
Greek
Female Unemployment
Female Unemployment Comparison
Potawatomi
Greeks
5.2%
FEMALE UNEMPLOYMENT
65.9/ 100
METRIC RATING
162nd/ 347
METRIC RANK
4.9%
FEMALE UNEMPLOYMENT
99.4/ 100
METRIC RATING
44th/ 347
METRIC RANK
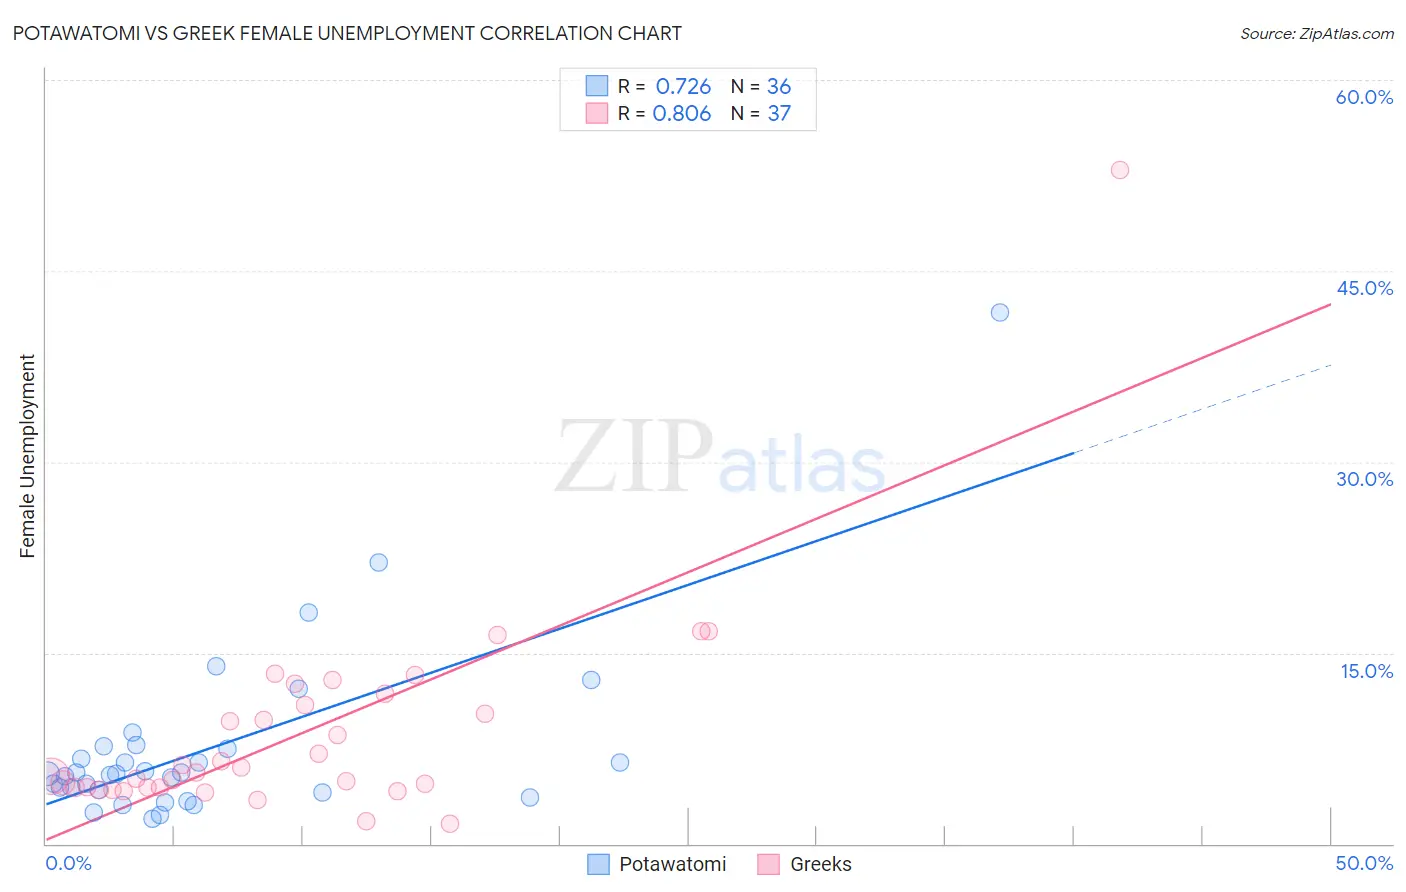
Potawatomi vs Greek Female Unemployment Correlation Chart
The statistical analysis conducted on geographies consisting of 117,345,234 people shows a strong positive correlation between the proportion of Potawatomi and unemploymnet rate among females in the United States with a correlation coefficient (R) of 0.726 and weighted average of 5.2%. Similarly, the statistical analysis conducted on geographies consisting of 478,278,385 people shows a very strong positive correlation between the proportion of Greeks and unemploymnet rate among females in the United States with a correlation coefficient (R) of 0.806 and weighted average of 4.9%, a difference of 7.2%.
Female Unemployment Correlation Summary
| Measurement | Potawatomi | Greek |
| Minimum | 2.0% | 1.6% |
| Maximum | 41.7% | 52.9% |
| Range | 39.7% | 51.3% |
| Mean | 7.5% | 8.7% |
| Median | 5.5% | 5.6% |
| Interquartile 25% (IQ1) | 4.1% | 4.4% |
| Interquartile 75% (IQ3) | 7.6% | 11.4% |
| Interquartile Range (IQR) | 3.5% | 7.0% |
| Standard Deviation (Sample) | 7.3% | 8.6% |
| Standard Deviation (Population) | 7.2% | 8.5% |
Similar Demographics by Female Unemployment
Demographics Similar to Potawatomi by Female Unemployment
In terms of female unemployment, the demographic groups most similar to Potawatomi are Immigrants from Pakistan (5.2%, a difference of 0.050%), Immigrants from Spain (5.2%, a difference of 0.060%), Immigrants from Micronesia (5.2%, a difference of 0.070%), Immigrants from Asia (5.2%, a difference of 0.11%), and Bangladeshi (5.2%, a difference of 0.11%).
| Demographics | Rating | Rank | Female Unemployment |
| Immigrants | Egypt | 70.0 /100 | #155 | Good 5.2% |
| Immigrants | Northern Africa | 69.6 /100 | #156 | Good 5.2% |
| Immigrants | Russia | 69.3 /100 | #157 | Good 5.2% |
| Albanians | 68.3 /100 | #158 | Good 5.2% |
| Immigrants | Micronesia | 66.9 /100 | #159 | Good 5.2% |
| Immigrants | Spain | 66.8 /100 | #160 | Good 5.2% |
| Immigrants | Pakistan | 66.7 /100 | #161 | Good 5.2% |
| Potawatomi | 65.9 /100 | #162 | Good 5.2% |
| Immigrants | Asia | 64.3 /100 | #163 | Good 5.2% |
| Bangladeshis | 64.3 /100 | #164 | Good 5.2% |
| Syrians | 62.8 /100 | #165 | Good 5.2% |
| Native Hawaiians | 62.7 /100 | #166 | Good 5.2% |
| Immigrants | Thailand | 62.1 /100 | #167 | Good 5.2% |
| Sri Lankans | 59.4 /100 | #168 | Average 5.2% |
| Immigrants | Chile | 59.0 /100 | #169 | Average 5.2% |
Demographics Similar to Greeks by Female Unemployment
In terms of female unemployment, the demographic groups most similar to Greeks are Austrian (4.9%, a difference of 0.080%), Immigrants from Bulgaria (4.9%, a difference of 0.10%), Eastern European (4.9%, a difference of 0.11%), Okinawan (4.9%, a difference of 0.19%), and Italian (4.8%, a difference of 0.28%).
| Demographics | Rating | Rank | Female Unemployment |
| Pennsylvania Germans | 99.6 /100 | #37 | Exceptional 4.8% |
| Northern Europeans | 99.6 /100 | #38 | Exceptional 4.8% |
| Scotch-Irish | 99.6 /100 | #39 | Exceptional 4.8% |
| French | 99.6 /100 | #40 | Exceptional 4.8% |
| Tongans | 99.5 /100 | #41 | Exceptional 4.8% |
| Italians | 99.5 /100 | #42 | Exceptional 4.8% |
| Eastern Europeans | 99.4 /100 | #43 | Exceptional 4.9% |
| Greeks | 99.4 /100 | #44 | Exceptional 4.9% |
| Austrians | 99.3 /100 | #45 | Exceptional 4.9% |
| Immigrants | Bulgaria | 99.3 /100 | #46 | Exceptional 4.9% |
| Okinawans | 99.3 /100 | #47 | Exceptional 4.9% |
| Thais | 99.2 /100 | #48 | Exceptional 4.9% |
| Australians | 99.2 /100 | #49 | Exceptional 4.9% |
| Immigrants | Cuba | 99.1 /100 | #50 | Exceptional 4.9% |
| Cambodians | 99.1 /100 | #51 | Exceptional 4.9% |