Basque vs Immigrants from Ecuador Female Unemployment
COMPARE
Basque
Immigrants from Ecuador
Female Unemployment
Female Unemployment Comparison
Basques
Immigrants from Ecuador
5.1%
FEMALE UNEMPLOYMENT
86.5/ 100
METRIC RATING
125th/ 347
METRIC RANK
6.4%
FEMALE UNEMPLOYMENT
0.0/ 100
METRIC RATING
314th/ 347
METRIC RANK
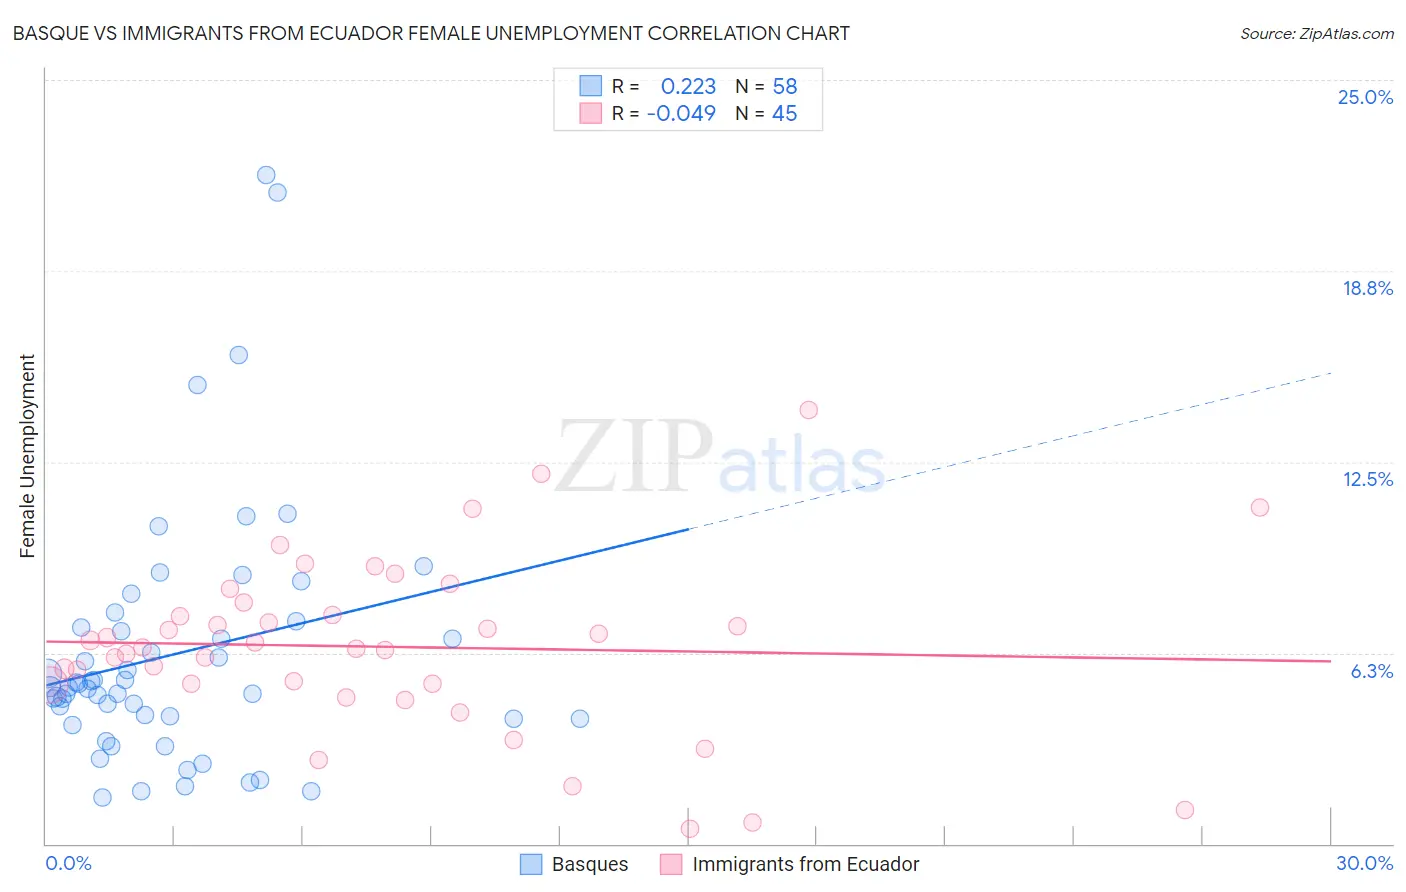
Basque vs Immigrants from Ecuador Female Unemployment Correlation Chart
The statistical analysis conducted on geographies consisting of 165,405,269 people shows a weak positive correlation between the proportion of Basques and unemploymnet rate among females in the United States with a correlation coefficient (R) of 0.223 and weighted average of 5.1%. Similarly, the statistical analysis conducted on geographies consisting of 270,415,803 people shows no correlation between the proportion of Immigrants from Ecuador and unemploymnet rate among females in the United States with a correlation coefficient (R) of -0.049 and weighted average of 6.4%, a difference of 24.4%.
Female Unemployment Correlation Summary
| Measurement | Basque | Immigrants from Ecuador |
| Minimum | 1.5% | 0.51% |
| Maximum | 21.9% | 14.2% |
| Range | 20.4% | 13.7% |
| Mean | 6.2% | 6.4% |
| Median | 5.1% | 6.4% |
| Interquartile 25% (IQ1) | 4.1% | 5.2% |
| Interquartile 75% (IQ3) | 7.1% | 7.7% |
| Interquartile Range (IQR) | 3.0% | 2.5% |
| Standard Deviation (Sample) | 4.1% | 2.8% |
| Standard Deviation (Population) | 4.1% | 2.8% |
Similar Demographics by Female Unemployment
Demographics Similar to Basques by Female Unemployment
In terms of female unemployment, the demographic groups most similar to Basques are Immigrants from Korea (5.1%, a difference of 0.020%), Immigrants from Hungary (5.1%, a difference of 0.060%), Chilean (5.1%, a difference of 0.090%), Immigrants from Europe (5.1%, a difference of 0.10%), and Ethiopian (5.1%, a difference of 0.10%).
| Demographics | Rating | Rank | Female Unemployment |
| Immigrants | Croatia | 89.9 /100 | #118 | Excellent 5.1% |
| Immigrants | North Macedonia | 88.3 /100 | #119 | Excellent 5.1% |
| Immigrants | Romania | 88.1 /100 | #120 | Excellent 5.1% |
| Immigrants | Western Europe | 88.1 /100 | #121 | Excellent 5.1% |
| Immigrants | Germany | 87.6 /100 | #122 | Excellent 5.1% |
| Immigrants | South Africa | 87.6 /100 | #123 | Excellent 5.1% |
| Immigrants | Europe | 87.2 /100 | #124 | Excellent 5.1% |
| Basques | 86.5 /100 | #125 | Excellent 5.1% |
| Immigrants | Korea | 86.3 /100 | #126 | Excellent 5.1% |
| Immigrants | Hungary | 86.0 /100 | #127 | Excellent 5.1% |
| Chileans | 85.8 /100 | #128 | Excellent 5.1% |
| Ethiopians | 85.7 /100 | #129 | Excellent 5.1% |
| Maltese | 85.5 /100 | #130 | Excellent 5.1% |
| Immigrants | Ethiopia | 85.4 /100 | #131 | Excellent 5.1% |
| Immigrants | Sri Lanka | 85.0 /100 | #132 | Excellent 5.1% |
Demographics Similar to Immigrants from Ecuador by Female Unemployment
In terms of female unemployment, the demographic groups most similar to Immigrants from Ecuador are Belizean (6.3%, a difference of 0.23%), Immigrants from Grenada (6.3%, a difference of 0.24%), Pueblo (6.4%, a difference of 0.31%), Houma (6.4%, a difference of 0.60%), and Immigrants from Mexico (6.3%, a difference of 0.90%).
| Demographics | Rating | Rank | Female Unemployment |
| Shoshone | 0.0 /100 | #307 | Tragic 6.2% |
| Hispanics or Latinos | 0.0 /100 | #308 | Tragic 6.2% |
| Ecuadorians | 0.0 /100 | #309 | Tragic 6.3% |
| Central American Indians | 0.0 /100 | #310 | Tragic 6.3% |
| Immigrants | Mexico | 0.0 /100 | #311 | Tragic 6.3% |
| Immigrants | Grenada | 0.0 /100 | #312 | Tragic 6.3% |
| Belizeans | 0.0 /100 | #313 | Tragic 6.3% |
| Immigrants | Ecuador | 0.0 /100 | #314 | Tragic 6.4% |
| Pueblo | 0.0 /100 | #315 | Tragic 6.4% |
| Houma | 0.0 /100 | #316 | Tragic 6.4% |
| Immigrants | St. Vincent and the Grenadines | 0.0 /100 | #317 | Tragic 6.4% |
| British West Indians | 0.0 /100 | #318 | Tragic 6.4% |
| Immigrants | Bangladesh | 0.0 /100 | #319 | Tragic 6.5% |
| Immigrants | Dominica | 0.0 /100 | #320 | Tragic 6.5% |
| Blacks/African Americans | 0.0 /100 | #321 | Tragic 6.5% |