Potawatomi vs Immigrants from Venezuela Female Unemployment
COMPARE
Potawatomi
Immigrants from Venezuela
Female Unemployment
Female Unemployment Comparison
Potawatomi
Immigrants from Venezuela
5.2%
FEMALE UNEMPLOYMENT
65.9/ 100
METRIC RATING
162nd/ 347
METRIC RANK
5.0%
FEMALE UNEMPLOYMENT
97.9/ 100
METRIC RATING
76th/ 347
METRIC RANK
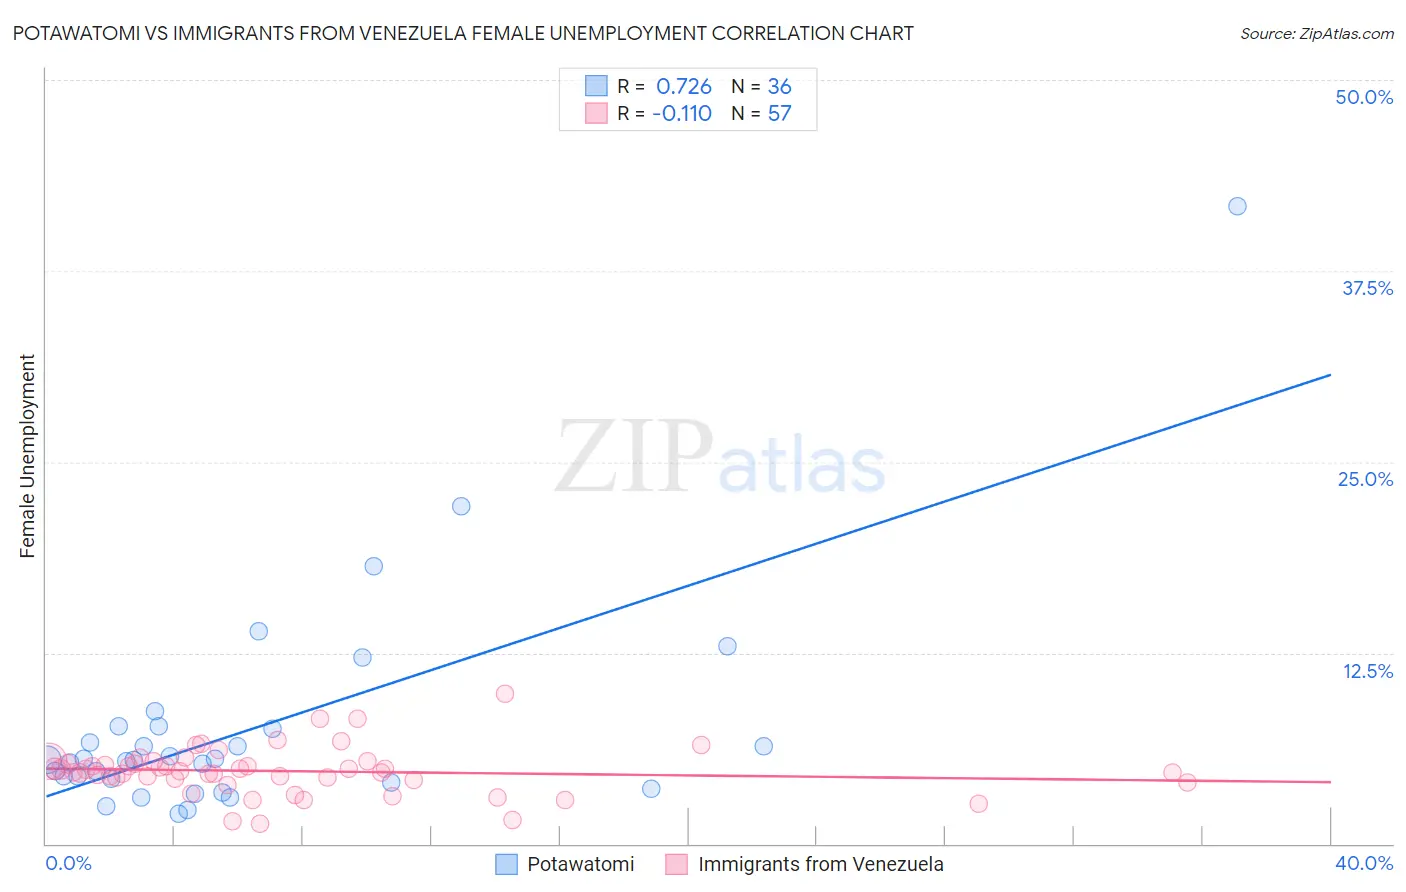
Potawatomi vs Immigrants from Venezuela Female Unemployment Correlation Chart
The statistical analysis conducted on geographies consisting of 117,345,234 people shows a strong positive correlation between the proportion of Potawatomi and unemploymnet rate among females in the United States with a correlation coefficient (R) of 0.726 and weighted average of 5.2%. Similarly, the statistical analysis conducted on geographies consisting of 287,321,632 people shows a poor negative correlation between the proportion of Immigrants from Venezuela and unemploymnet rate among females in the United States with a correlation coefficient (R) of -0.110 and weighted average of 5.0%, a difference of 5.1%.
Female Unemployment Correlation Summary
| Measurement | Potawatomi | Immigrants from Venezuela |
| Minimum | 2.0% | 1.3% |
| Maximum | 41.7% | 9.8% |
| Range | 39.7% | 8.5% |
| Mean | 7.5% | 4.8% |
| Median | 5.5% | 4.7% |
| Interquartile 25% (IQ1) | 4.1% | 4.2% |
| Interquartile 75% (IQ3) | 7.6% | 5.3% |
| Interquartile Range (IQR) | 3.5% | 1.1% |
| Standard Deviation (Sample) | 7.3% | 1.5% |
| Standard Deviation (Population) | 7.2% | 1.5% |
Similar Demographics by Female Unemployment
Demographics Similar to Potawatomi by Female Unemployment
In terms of female unemployment, the demographic groups most similar to Potawatomi are Immigrants from Pakistan (5.2%, a difference of 0.050%), Immigrants from Spain (5.2%, a difference of 0.060%), Immigrants from Micronesia (5.2%, a difference of 0.070%), Immigrants from Asia (5.2%, a difference of 0.11%), and Bangladeshi (5.2%, a difference of 0.11%).
| Demographics | Rating | Rank | Female Unemployment |
| Immigrants | Egypt | 70.0 /100 | #155 | Good 5.2% |
| Immigrants | Northern Africa | 69.6 /100 | #156 | Good 5.2% |
| Immigrants | Russia | 69.3 /100 | #157 | Good 5.2% |
| Albanians | 68.3 /100 | #158 | Good 5.2% |
| Immigrants | Micronesia | 66.9 /100 | #159 | Good 5.2% |
| Immigrants | Spain | 66.8 /100 | #160 | Good 5.2% |
| Immigrants | Pakistan | 66.7 /100 | #161 | Good 5.2% |
| Potawatomi | 65.9 /100 | #162 | Good 5.2% |
| Immigrants | Asia | 64.3 /100 | #163 | Good 5.2% |
| Bangladeshis | 64.3 /100 | #164 | Good 5.2% |
| Syrians | 62.8 /100 | #165 | Good 5.2% |
| Native Hawaiians | 62.7 /100 | #166 | Good 5.2% |
| Immigrants | Thailand | 62.1 /100 | #167 | Good 5.2% |
| Sri Lankans | 59.4 /100 | #168 | Average 5.2% |
| Immigrants | Chile | 59.0 /100 | #169 | Average 5.2% |
Demographics Similar to Immigrants from Venezuela by Female Unemployment
In terms of female unemployment, the demographic groups most similar to Immigrants from Venezuela are Immigrants from Singapore (5.0%, a difference of 0.010%), Immigrants from Bolivia (5.0%, a difference of 0.030%), Russian (5.0%, a difference of 0.040%), Immigrants from Northern Europe (4.9%, a difference of 0.070%), and Mongolian (5.0%, a difference of 0.090%).
| Demographics | Rating | Rank | Female Unemployment |
| Immigrants | Ireland | 98.2 /100 | #69 | Exceptional 4.9% |
| Osage | 98.2 /100 | #70 | Exceptional 4.9% |
| German Russians | 98.1 /100 | #71 | Exceptional 4.9% |
| Immigrants | Northern Europe | 98.0 /100 | #72 | Exceptional 4.9% |
| Russians | 98.0 /100 | #73 | Exceptional 5.0% |
| Immigrants | Bolivia | 98.0 /100 | #74 | Exceptional 5.0% |
| Immigrants | Singapore | 98.0 /100 | #75 | Exceptional 5.0% |
| Immigrants | Venezuela | 97.9 /100 | #76 | Exceptional 5.0% |
| Mongolians | 97.8 /100 | #77 | Exceptional 5.0% |
| Immigrants | Netherlands | 97.8 /100 | #78 | Exceptional 5.0% |
| Turks | 97.6 /100 | #79 | Exceptional 5.0% |
| New Zealanders | 97.4 /100 | #80 | Exceptional 5.0% |
| Filipinos | 97.3 /100 | #81 | Exceptional 5.0% |
| Immigrants | Australia | 97.3 /100 | #82 | Exceptional 5.0% |
| Immigrants | Serbia | 97.2 /100 | #83 | Exceptional 5.0% |