Kenyan vs Greek Female Unemployment

COMPARE

Kenyan
Race
Ancestry
AfghanAfricanAlaska NativeAlaskan AthabascanAlbanianAleutAlsatianAmericanApacheArabArapahoArgentineanArmenianAssyrian/Chaldean/SyriacAustralianAustrianBahamianBangladeshiBarbadianBasqueBelgianBelizeanBermudanBhutaneseBlackfeetBolivianBrazilianBritishBritish West IndianBulgarianBurmeseCajunCambodianCanadianCape VerdeanCarpatho RusynCelticCentral AmericanCentral American IndianCherokeeCheyenneChickasawChileanChineseChippewaChoctawColombianColvilleComancheCosta RicanCreeCreekCroatianCrowCubanCypriotCzechCzechoslovakianDanishDelawareDominicanDutchDutch West IndianEastern EuropeanEcuadorianEgyptianEnglishEstonianEthiopianEuropeanFijianFilipinoFinnishFrenchFrench American IndianFrench CanadianGermanGerman RussianGhanaianGuamanian/ChamorroGuatemalanGuyaneseHaitianHmongHonduranHopiHoumaHungarianIcelanderIndian (Asian)IndonesianInupiatIranianIraqiIrishIroquoisIsraeliItalianJamaicanJapaneseJordanianKenyanKiowaKoreanLaotianLatvianLebaneseLiberianLithuanianLumbeeLuxembourgerMacedonianMalaysianMalteseMarshalleseMenomineeMexicanMexican American IndianMongolianMoroccanNative HawaiianNavajoNepaleseNew ZealanderNicaraguanNigerianNorthern EuropeanNorwegianOkinawanOsageOttawaPaiutePakistaniPalestinianPanamanianParaguayanPennsylvania GermanPeruvianPimaPolishPortuguesePotawatomiPuebloPuerto RicanPuget Sound SalishRomanianRussianSalvadoranSamoanScandinavianScotch-IrishScottishSeminoleSenegaleseSerbianShoshoneSierra LeoneanSiouxSlavicSlovakSloveneSomaliSouth AfricanSouth AmericanSouth American IndianSoviet UnionSpaniardSpanishSpanish AmericanSpanish American IndianSri LankanSubsaharan AfricanSudaneseSwedishSwissSyrianTaiwaneseThaiTlingit-HaidaTohono O'OdhamTonganTrinidadian and TobagonianTsimshianTurkishU.S. Virgin IslanderUgandanUkrainianUruguayanUteVenezuelanVietnameseWelshWest IndianYakamaYaquiYugoslavianYumanYup'ikZimbabwean
Immigration
NonimmigrantsImmigrantsAfghanistanAfricaAlbaniaArgentinaArmeniaAsiaAustraliaAustriaBahamasBangladeshBarbadosBelarusBelgiumBelizeBoliviaBosnia and HerzegovinaBrazilBulgariaBurma/MyanmarCabo VerdeCambodiaCameroonCanadaCaribbeanCentral AmericaChileChinaColombiaCongoCosta RicaCroatiaCubaCzechoslovakiaDenmarkDominicaDominican RepublicEastern AfricaEastern AsiaEastern EuropeEcuadorEgyptEl SalvadorEnglandEritreaEthiopiaEuropeFijiFranceGermanyGhanaGreeceGrenadaGuatemalaGuyanaHaitiHondurasHong KongHungaryIndiaIndonesiaIranIraqIrelandIsraelItalyJamaicaJapanJordanKazakhstanKenyaKoreaKuwaitLaosLatin AmericaLatviaLebanonLiberiaLithuaniaMalaysiaMexicoMicronesiaMiddle AfricaMoldovaMoroccoNepalNetherlandsNicaraguaNigeriaNorth AmericaNorth MacedoniaNorthern AfricaNorthern EuropeNorwayOceaniaPakistanPanamaPeruPhilippinesPolandPortugalRomaniaRussiaSaudi ArabiaScotlandSenegalSerbiaSierra LeoneSingaporeSomaliaSouth AfricaSouth AmericaSouth Central AsiaSouth Eastern AsiaSouthern EuropeSpainSri LankaSt. Vincent and the GrenadinesSudanSwedenSwitzerlandSyriaTaiwanThailandTrinidad and TobagoTurkeyUgandaUkraineUruguayUzbekistanVenezuelaVietnamWest IndiesWestern AfricaWestern AsiaWestern EuropeYemenZaireZimbabweAzores
Greek
Race
Ancestry
AfghanAfricanAlaska NativeAlaskan AthabascanAlbanianAleutAlsatianAmericanApacheArabArapahoArgentineanArmenianAssyrian/Chaldean/SyriacAustralianAustrianBahamianBangladeshiBarbadianBasqueBelgianBelizeanBermudanBhutaneseBlackfeetBolivianBrazilianBritishBritish West IndianBulgarianBurmeseCajunCambodianCanadianCape VerdeanCarpatho RusynCelticCentral AmericanCentral American IndianCherokeeCheyenneChickasawChileanChineseChippewaChoctawColombianColvilleComancheCosta RicanCreeCreekCroatianCrowCubanCypriotCzechCzechoslovakianDanishDelawareDominicanDutchDutch West IndianEastern EuropeanEcuadorianEgyptianEnglishEstonianEthiopianEuropeanFijianFilipinoFinnishFrenchFrench American IndianFrench CanadianGermanGerman RussianGhanaianGreekGuamanian/ChamorroGuatemalanGuyaneseHaitianHmongHonduranHopiHoumaHungarianIcelanderIndian (Asian)IndonesianInupiatIranianIraqiIrishIroquoisIsraeliItalianJamaicanJapaneseJordanianKiowaKoreanLaotianLatvianLebaneseLiberianLithuanianLumbeeLuxembourgerMacedonianMalaysianMalteseMarshalleseMenomineeMexicanMexican American IndianMongolianMoroccanNative HawaiianNavajoNepaleseNew ZealanderNicaraguanNigerianNorthern EuropeanNorwegianOkinawanOsageOttawaPaiutePakistaniPalestinianPanamanianParaguayanPennsylvania GermanPeruvianPimaPolishPortuguesePotawatomiPuebloPuerto RicanPuget Sound SalishRomanianRussianSalvadoranSamoanScandinavianScotch-IrishScottishSeminoleSenegaleseSerbianShoshoneSierra LeoneanSiouxSlavicSlovakSloveneSomaliSouth AfricanSouth AmericanSouth American IndianSoviet UnionSpaniardSpanishSpanish AmericanSpanish American IndianSri LankanSubsaharan AfricanSudaneseSwedishSwissSyrianTaiwaneseThaiTlingit-HaidaTohono O'OdhamTonganTrinidadian and TobagonianTsimshianTurkishU.S. Virgin IslanderUgandanUkrainianUruguayanUteVenezuelanVietnameseWelshWest IndianYakamaYaquiYugoslavianYumanYup'ikZimbabwean
Immigration
NonimmigrantsImmigrantsAfghanistanAfricaAlbaniaArgentinaArmeniaAsiaAustraliaAustriaBahamasBangladeshBarbadosBelarusBelgiumBelizeBoliviaBosnia and HerzegovinaBrazilBulgariaBurma/MyanmarCabo VerdeCambodiaCameroonCanadaCaribbeanCentral AmericaChileChinaColombiaCongoCosta RicaCroatiaCubaCzechoslovakiaDenmarkDominicaDominican RepublicEastern AfricaEastern AsiaEastern EuropeEcuadorEgyptEl SalvadorEnglandEritreaEthiopiaEuropeFijiFranceGermanyGhanaGreeceGrenadaGuatemalaGuyanaHaitiHondurasHong KongHungaryIndiaIndonesiaIranIraqIrelandIsraelItalyJamaicaJapanJordanKazakhstanKenyaKoreaKuwaitLaosLatin AmericaLatviaLebanonLiberiaLithuaniaMalaysiaMexicoMicronesiaMiddle AfricaMoldovaMoroccoNepalNetherlandsNicaraguaNigeriaNorth AmericaNorth MacedoniaNorthern AfricaNorthern EuropeNorwayOceaniaPakistanPanamaPeruPhilippinesPolandPortugalRomaniaRussiaSaudi ArabiaScotlandSenegalSerbiaSierra LeoneSingaporeSomaliaSouth AfricaSouth AmericaSouth Central AsiaSouth Eastern AsiaSouthern EuropeSpainSri LankaSt. Vincent and the GrenadinesSudanSwedenSwitzerlandSyriaTaiwanThailandTrinidad and TobagoTurkeyUgandaUkraineUruguayUzbekistanVenezuelaVietnamWest IndiesWestern AfricaWestern AsiaWestern EuropeYemenZaireZimbabweAzores
Female Unemployment
Income
Poverty
Unemployment
Labor Participation
Family Structure
Vehicle Availability
Education Level
Disability

Female Unemployment Comparison

Kenyans

Greeks

Exceptional
Exceptional
5.0%
FEMALE UNEMPLOYMENT
93.7/ 100
METRIC RATING
104th/ 347
METRIC RANK
4.9%
FEMALE UNEMPLOYMENT
99.4/ 100
METRIC RATING
44th/ 347
METRIC RANK

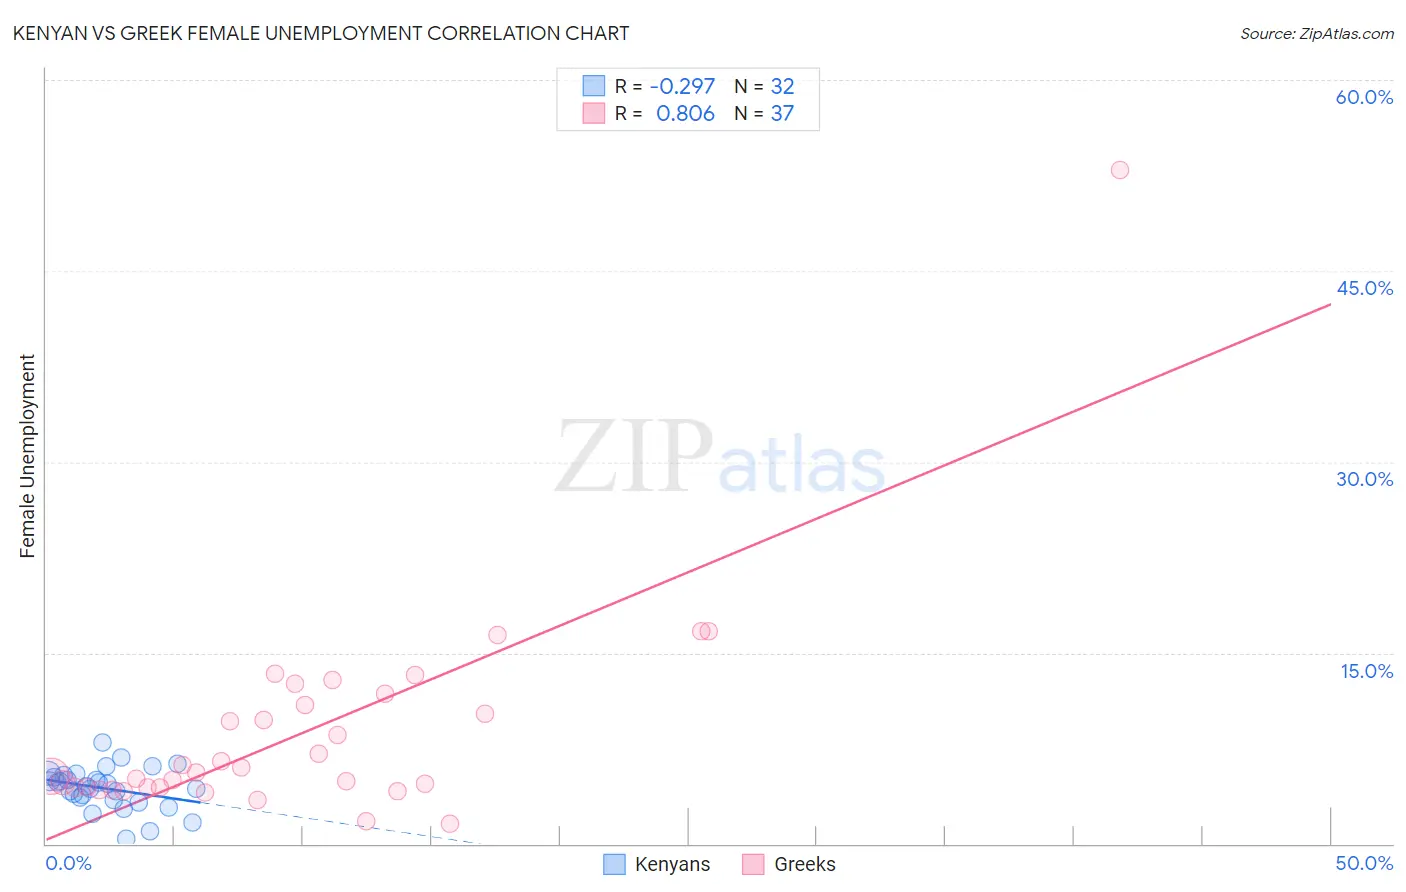
Kenyan vs Greek Female Unemployment Correlation Chart

The statistical analysis conducted on geographies consisting of 168,081,241 people shows a weak negative correlation between the proportion of Kenyans and unemploymnet rate among females in the United States with a correlation coefficient (R) of -0.297 and weighted average of 5.0%. Similarly, the statistical analysis conducted on geographies consisting of 478,278,385 people shows a very strong positive correlation between the proportion of Greeks and unemploymnet rate among females in the United States with a correlation coefficient (R) of 0.806 and weighted average of 4.9%, a difference of 3.8%.
Kenyan vs Greek Female Unemployment

Female Unemployment Correlation Summary

MeasurementKenyanGreek
Minimum0.40%1.6%
Maximum7.9%52.9%
Range7.5%51.3%
Mean4.4%8.7%
Median4.6%5.6%
Interquartile 25% (IQ1)3.5%4.4%
Interquartile 75% (IQ3)5.3%11.4%
Interquartile Range (IQR)1.8%7.0%
Standard Deviation (Sample)1.6%8.6%
Standard Deviation (Population)1.6%8.5%

Similar Demographics by Female Unemployment

Demographics Similar to Kenyans by Female Unemployment

In terms of female unemployment, the demographic groups most similar to Kenyans are Immigrants from England (5.0%, a difference of 0.020%), Paraguayan (5.1%, a difference of 0.12%), Immigrants from Switzerland (5.1%, a difference of 0.15%), Puget Sound Salish (5.1%, a difference of 0.17%), and Immigrants from Eastern Africa (5.1%, a difference of 0.21%).
DemographicsRating | RankFemale Unemployment
Immigrants | Somalia
95.2
/100
|
#97
Exceptional
5.0%
Immigrants | Kuwait
95.2
/100
|
#98
Exceptional
5.0%
Immigrants | Zaire
95.2
/100
|
#99
Exceptional
5.0%
Indonesians
95.1
/100
|
#100
Exceptional
5.0%
Immigrants | Czechoslovakia
95.0
/100
|
#101
Exceptional
5.0%
Immigrants | Kenya
94.8
/100
|
#102
Exceptional
5.0%
Somalis
94.6
/100
|
#103
Exceptional
5.0%
Kenyans
93.7
/100
|
#104
Exceptional
5.0%
Immigrants | England
93.6
/100
|
#105
Exceptional
5.0%
Paraguayans
93.2
/100
|
#106
Exceptional
5.1%
Immigrants | Switzerland
93.1
/100
|
#107
Exceptional
5.1%
Puget Sound Salish
93.0
/100
|
#108
Exceptional
5.1%
Immigrants | Eastern Africa
92.8
/100
|
#109
Exceptional
5.1%
Macedonians
92.4
/100
|
#110
Exceptional
5.1%
Immigrants | Burma/Myanmar
92.3
/100
|
#111
Exceptional
5.1%

Demographics Similar to Greeks by Female Unemployment

In terms of female unemployment, the demographic groups most similar to Greeks are Austrian (4.9%, a difference of 0.080%), Immigrants from Bulgaria (4.9%, a difference of 0.10%), Eastern European (4.9%, a difference of 0.11%), Okinawan (4.9%, a difference of 0.19%), and Italian (4.8%, a difference of 0.28%).
DemographicsRating | RankFemale Unemployment
Pennsylvania Germans
99.6
/100
|
#37
Exceptional
4.8%
Northern Europeans
99.6
/100
|
#38
Exceptional
4.8%
Scotch-Irish
99.6
/100
|
#39
Exceptional
4.8%
French
99.6
/100
|
#40
Exceptional
4.8%
Tongans
99.5
/100
|
#41
Exceptional
4.8%
Italians
99.5
/100
|
#42
Exceptional
4.8%
Eastern Europeans
99.4
/100
|
#43
Exceptional
4.9%
Greeks
99.4
/100
|
#44
Exceptional
4.9%
Austrians
99.3
/100
|
#45
Exceptional
4.9%
Immigrants | Bulgaria
99.3
/100
|
#46
Exceptional
4.9%
Okinawans
99.3
/100
|
#47
Exceptional
4.9%
Thais
99.2
/100
|
#48
Exceptional
4.9%
Australians
99.2
/100
|
#49
Exceptional
4.9%
Immigrants | Cuba
99.1
/100
|
#50
Exceptional
4.9%
Cambodians
99.1
/100
|
#51
Exceptional
4.9%