Senegalese vs Greek Female Unemployment
COMPARE
Senegalese
Greek
Female Unemployment
Female Unemployment Comparison
Senegalese
Greeks
6.0%
FEMALE UNEMPLOYMENT
0.0/ 100
METRIC RATING
275th/ 347
METRIC RANK
4.9%
FEMALE UNEMPLOYMENT
99.4/ 100
METRIC RATING
44th/ 347
METRIC RANK
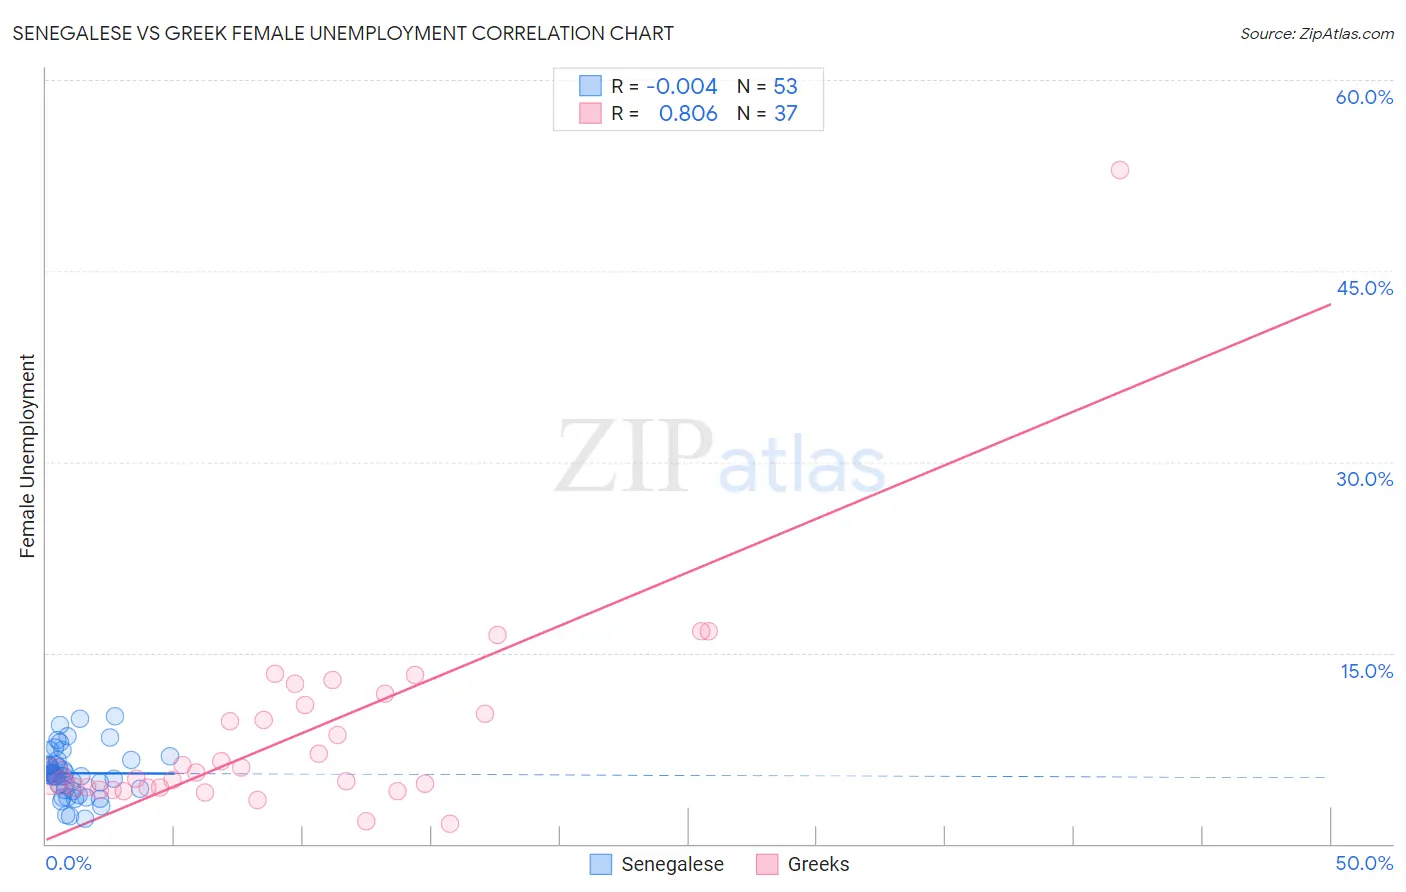
Senegalese vs Greek Female Unemployment Correlation Chart
The statistical analysis conducted on geographies consisting of 78,123,834 people shows no correlation between the proportion of Senegalese and unemploymnet rate among females in the United States with a correlation coefficient (R) of -0.004 and weighted average of 6.0%. Similarly, the statistical analysis conducted on geographies consisting of 478,278,385 people shows a very strong positive correlation between the proportion of Greeks and unemploymnet rate among females in the United States with a correlation coefficient (R) of 0.806 and weighted average of 4.9%, a difference of 23.1%.
Female Unemployment Correlation Summary
| Measurement | Senegalese | Greek |
| Minimum | 2.0% | 1.6% |
| Maximum | 10.0% | 52.9% |
| Range | 8.0% | 51.3% |
| Mean | 5.5% | 8.7% |
| Median | 5.4% | 5.6% |
| Interquartile 25% (IQ1) | 4.3% | 4.4% |
| Interquartile 75% (IQ3) | 6.4% | 11.4% |
| Interquartile Range (IQR) | 2.2% | 7.0% |
| Standard Deviation (Sample) | 1.8% | 8.6% |
| Standard Deviation (Population) | 1.8% | 8.5% |
Similar Demographics by Female Unemployment
Demographics Similar to Senegalese by Female Unemployment
In terms of female unemployment, the demographic groups most similar to Senegalese are Bahamian (6.0%, a difference of 0.040%), Immigrants from Ghana (6.0%, a difference of 0.43%), Yaqui (6.0%, a difference of 0.43%), African (5.9%, a difference of 0.49%), and Armenian (6.0%, a difference of 0.55%).
| Demographics | Rating | Rank | Female Unemployment |
| Hondurans | 0.0 /100 | #268 | Tragic 5.9% |
| Immigrants | Western Africa | 0.0 /100 | #269 | Tragic 5.9% |
| Immigrants | Honduras | 0.0 /100 | #270 | Tragic 5.9% |
| Central Americans | 0.0 /100 | #271 | Tragic 5.9% |
| Lumbee | 0.0 /100 | #272 | Tragic 5.9% |
| Ghanaians | 0.0 /100 | #273 | Tragic 5.9% |
| Africans | 0.0 /100 | #274 | Tragic 5.9% |
| Senegalese | 0.0 /100 | #275 | Tragic 6.0% |
| Bahamians | 0.0 /100 | #276 | Tragic 6.0% |
| Immigrants | Ghana | 0.0 /100 | #277 | Tragic 6.0% |
| Yaqui | 0.0 /100 | #278 | Tragic 6.0% |
| Armenians | 0.0 /100 | #279 | Tragic 6.0% |
| Mexican American Indians | 0.0 /100 | #280 | Tragic 6.0% |
| Guatemalans | 0.0 /100 | #281 | Tragic 6.0% |
| Colville | 0.0 /100 | #282 | Tragic 6.0% |
Demographics Similar to Greeks by Female Unemployment
In terms of female unemployment, the demographic groups most similar to Greeks are Austrian (4.9%, a difference of 0.080%), Immigrants from Bulgaria (4.9%, a difference of 0.10%), Eastern European (4.9%, a difference of 0.11%), Okinawan (4.9%, a difference of 0.19%), and Italian (4.8%, a difference of 0.28%).
| Demographics | Rating | Rank | Female Unemployment |
| Pennsylvania Germans | 99.6 /100 | #37 | Exceptional 4.8% |
| Northern Europeans | 99.6 /100 | #38 | Exceptional 4.8% |
| Scotch-Irish | 99.6 /100 | #39 | Exceptional 4.8% |
| French | 99.6 /100 | #40 | Exceptional 4.8% |
| Tongans | 99.5 /100 | #41 | Exceptional 4.8% |
| Italians | 99.5 /100 | #42 | Exceptional 4.8% |
| Eastern Europeans | 99.4 /100 | #43 | Exceptional 4.9% |
| Greeks | 99.4 /100 | #44 | Exceptional 4.9% |
| Austrians | 99.3 /100 | #45 | Exceptional 4.9% |
| Immigrants | Bulgaria | 99.3 /100 | #46 | Exceptional 4.9% |
| Okinawans | 99.3 /100 | #47 | Exceptional 4.9% |
| Thais | 99.2 /100 | #48 | Exceptional 4.9% |
| Australians | 99.2 /100 | #49 | Exceptional 4.9% |
| Immigrants | Cuba | 99.1 /100 | #50 | Exceptional 4.9% |
| Cambodians | 99.1 /100 | #51 | Exceptional 4.9% |