Potawatomi vs Greek Median Female Earnings
COMPARE
Potawatomi
Greek
Median Female Earnings
Median Female Earnings Comparison
Potawatomi
Greeks
$34,739
MEDIAN FEMALE EARNINGS
0.0/ 100
METRIC RATING
317th/ 347
METRIC RANK
$42,336
MEDIAN FEMALE EARNINGS
99.6/ 100
METRIC RATING
79th/ 347
METRIC RANK
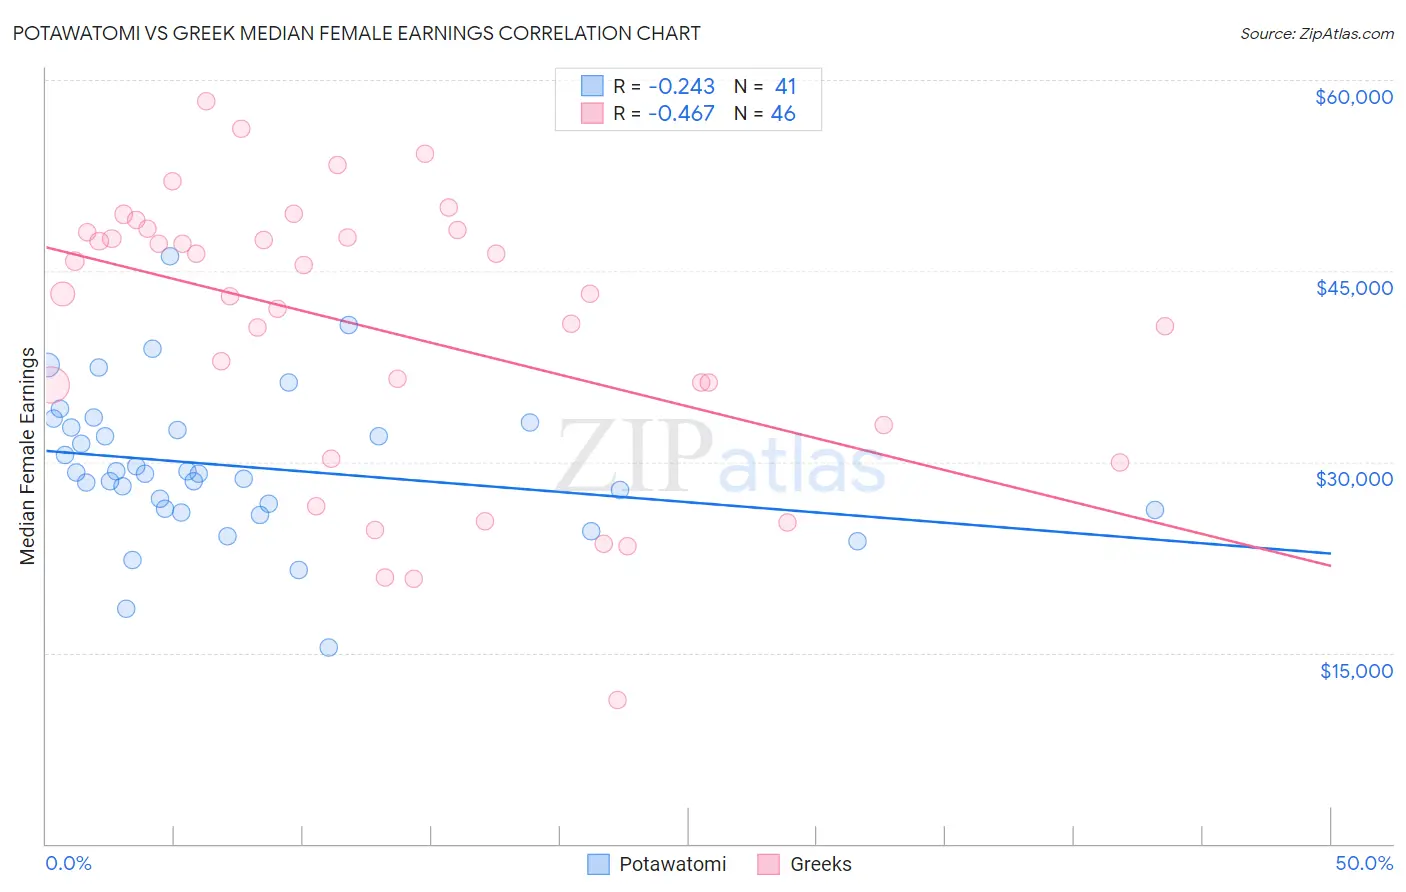
Potawatomi vs Greek Median Female Earnings Correlation Chart
The statistical analysis conducted on geographies consisting of 117,757,146 people shows a weak negative correlation between the proportion of Potawatomi and median female earnings in the United States with a correlation coefficient (R) of -0.243 and weighted average of $34,739. Similarly, the statistical analysis conducted on geographies consisting of 482,348,495 people shows a moderate negative correlation between the proportion of Greeks and median female earnings in the United States with a correlation coefficient (R) of -0.467 and weighted average of $42,336, a difference of 21.9%.
Median Female Earnings Correlation Summary
| Measurement | Potawatomi | Greek |
| Minimum | $15,417 | $11,250 |
| Maximum | $46,172 | $58,379 |
| Range | $30,755 | $47,129 |
| Mean | $29,667 | $40,351 |
| Median | $29,066 | $43,165 |
| Interquartile 25% (IQ1) | $26,292 | $32,889 |
| Interquartile 75% (IQ3) | $32,931 | $48,068 |
| Interquartile Range (IQR) | $6,639 | $15,179 |
| Standard Deviation (Sample) | $5,830 | $10,999 |
| Standard Deviation (Population) | $5,758 | $10,879 |
Similar Demographics by Median Female Earnings
Demographics Similar to Potawatomi by Median Female Earnings
In terms of median female earnings, the demographic groups most similar to Potawatomi are Cherokee ($34,742, a difference of 0.010%), Immigrants from Yemen ($34,693, a difference of 0.13%), Pennsylvania German ($34,802, a difference of 0.18%), Shoshone ($34,677, a difference of 0.18%), and Immigrants from Honduras ($34,647, a difference of 0.27%).
| Demographics | Rating | Rank | Median Female Earnings |
| Chippewa | 0.0 /100 | #310 | Tragic $35,003 |
| Ute | 0.0 /100 | #311 | Tragic $34,960 |
| Yaqui | 0.0 /100 | #312 | Tragic $34,943 |
| Cubans | 0.0 /100 | #313 | Tragic $34,942 |
| Apache | 0.0 /100 | #314 | Tragic $34,895 |
| Pennsylvania Germans | 0.0 /100 | #315 | Tragic $34,802 |
| Cherokee | 0.0 /100 | #316 | Tragic $34,742 |
| Potawatomi | 0.0 /100 | #317 | Tragic $34,739 |
| Immigrants | Yemen | 0.0 /100 | #318 | Tragic $34,693 |
| Shoshone | 0.0 /100 | #319 | Tragic $34,677 |
| Immigrants | Honduras | 0.0 /100 | #320 | Tragic $34,647 |
| Hispanics or Latinos | 0.0 /100 | #321 | Tragic $34,421 |
| Chickasaw | 0.0 /100 | #322 | Tragic $34,414 |
| Seminole | 0.0 /100 | #323 | Tragic $34,385 |
| Immigrants | Congo | 0.0 /100 | #324 | Tragic $34,317 |
Demographics Similar to Greeks by Median Female Earnings
In terms of median female earnings, the demographic groups most similar to Greeks are Immigrants from Moldova ($42,304, a difference of 0.080%), Immigrants from Albania ($42,388, a difference of 0.12%), Immigrants from Kazakhstan ($42,386, a difference of 0.12%), Immigrants from Southern Europe ($42,275, a difference of 0.15%), and Immigrants from Morocco ($42,229, a difference of 0.25%).
| Demographics | Rating | Rank | Median Female Earnings |
| Albanians | 99.8 /100 | #72 | Exceptional $42,584 |
| Mongolians | 99.7 /100 | #73 | Exceptional $42,542 |
| Immigrants | South Africa | 99.7 /100 | #74 | Exceptional $42,508 |
| New Zealanders | 99.7 /100 | #75 | Exceptional $42,446 |
| Immigrants | Italy | 99.7 /100 | #76 | Exceptional $42,446 |
| Immigrants | Albania | 99.6 /100 | #77 | Exceptional $42,388 |
| Immigrants | Kazakhstan | 99.6 /100 | #78 | Exceptional $42,386 |
| Greeks | 99.6 /100 | #79 | Exceptional $42,336 |
| Immigrants | Moldova | 99.6 /100 | #80 | Exceptional $42,304 |
| Immigrants | Southern Europe | 99.5 /100 | #81 | Exceptional $42,275 |
| Immigrants | Morocco | 99.5 /100 | #82 | Exceptional $42,229 |
| Immigrants | Sierra Leone | 99.5 /100 | #83 | Exceptional $42,214 |
| Armenians | 99.5 /100 | #84 | Exceptional $42,212 |
| Laotians | 99.4 /100 | #85 | Exceptional $42,133 |
| Immigrants | St. Vincent and the Grenadines | 99.3 /100 | #86 | Exceptional $42,108 |