Immigrants from Belize vs Greek Female Unemployment
COMPARE
Immigrants from Belize
Greek
Female Unemployment
Female Unemployment Comparison
Immigrants from Belize
Greeks
6.5%
FEMALE UNEMPLOYMENT
0.0/ 100
METRIC RATING
323rd/ 347
METRIC RANK
4.9%
FEMALE UNEMPLOYMENT
99.4/ 100
METRIC RATING
44th/ 347
METRIC RANK
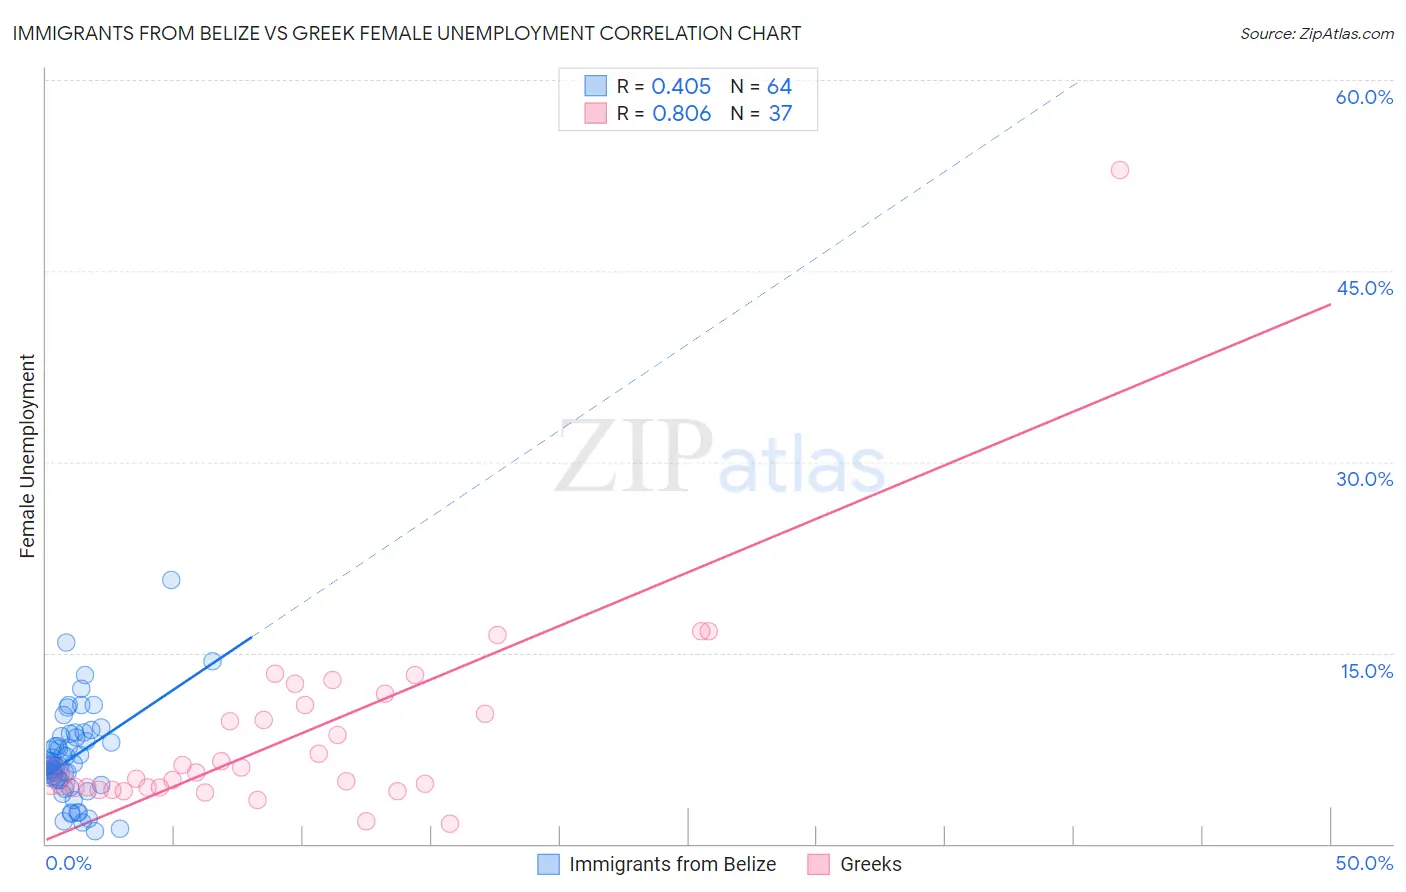
Immigrants from Belize vs Greek Female Unemployment Correlation Chart
The statistical analysis conducted on geographies consisting of 130,161,278 people shows a moderate positive correlation between the proportion of Immigrants from Belize and unemploymnet rate among females in the United States with a correlation coefficient (R) of 0.405 and weighted average of 6.5%. Similarly, the statistical analysis conducted on geographies consisting of 478,278,385 people shows a very strong positive correlation between the proportion of Greeks and unemploymnet rate among females in the United States with a correlation coefficient (R) of 0.806 and weighted average of 4.9%, a difference of 33.9%.
Female Unemployment Correlation Summary
| Measurement | Immigrants from Belize | Greek |
| Minimum | 1.0% | 1.6% |
| Maximum | 20.7% | 52.9% |
| Range | 19.7% | 51.3% |
| Mean | 6.8% | 8.7% |
| Median | 6.2% | 5.6% |
| Interquartile 25% (IQ1) | 5.0% | 4.4% |
| Interquartile 75% (IQ3) | 8.4% | 11.4% |
| Interquartile Range (IQR) | 3.4% | 7.0% |
| Standard Deviation (Sample) | 3.6% | 8.6% |
| Standard Deviation (Population) | 3.5% | 8.5% |
Similar Demographics by Female Unemployment
Demographics Similar to Immigrants from Belize by Female Unemployment
In terms of female unemployment, the demographic groups most similar to Immigrants from Belize are Vietnamese (6.5%, a difference of 0.10%), Black/African American (6.5%, a difference of 0.18%), Immigrants from Dominica (6.5%, a difference of 0.72%), Immigrants from Bangladesh (6.5%, a difference of 0.73%), and British West Indian (6.4%, a difference of 0.92%).
| Demographics | Rating | Rank | Female Unemployment |
| Houma | 0.0 /100 | #316 | Tragic 6.4% |
| Immigrants | St. Vincent and the Grenadines | 0.0 /100 | #317 | Tragic 6.4% |
| British West Indians | 0.0 /100 | #318 | Tragic 6.4% |
| Immigrants | Bangladesh | 0.0 /100 | #319 | Tragic 6.5% |
| Immigrants | Dominica | 0.0 /100 | #320 | Tragic 6.5% |
| Blacks/African Americans | 0.0 /100 | #321 | Tragic 6.5% |
| Vietnamese | 0.0 /100 | #322 | Tragic 6.5% |
| Immigrants | Belize | 0.0 /100 | #323 | Tragic 6.5% |
| Cheyenne | 0.0 /100 | #324 | Tragic 6.6% |
| Apache | 0.0 /100 | #325 | Tragic 6.6% |
| Natives/Alaskans | 0.0 /100 | #326 | Tragic 6.6% |
| Alaska Natives | 0.0 /100 | #327 | Tragic 6.6% |
| Guyanese | 0.0 /100 | #328 | Tragic 6.7% |
| Immigrants | Guyana | 0.0 /100 | #329 | Tragic 6.7% |
| Yakama | 0.0 /100 | #330 | Tragic 6.7% |
Demographics Similar to Greeks by Female Unemployment
In terms of female unemployment, the demographic groups most similar to Greeks are Austrian (4.9%, a difference of 0.080%), Immigrants from Bulgaria (4.9%, a difference of 0.10%), Eastern European (4.9%, a difference of 0.11%), Okinawan (4.9%, a difference of 0.19%), and Italian (4.8%, a difference of 0.28%).
| Demographics | Rating | Rank | Female Unemployment |
| Pennsylvania Germans | 99.6 /100 | #37 | Exceptional 4.8% |
| Northern Europeans | 99.6 /100 | #38 | Exceptional 4.8% |
| Scotch-Irish | 99.6 /100 | #39 | Exceptional 4.8% |
| French | 99.6 /100 | #40 | Exceptional 4.8% |
| Tongans | 99.5 /100 | #41 | Exceptional 4.8% |
| Italians | 99.5 /100 | #42 | Exceptional 4.8% |
| Eastern Europeans | 99.4 /100 | #43 | Exceptional 4.9% |
| Greeks | 99.4 /100 | #44 | Exceptional 4.9% |
| Austrians | 99.3 /100 | #45 | Exceptional 4.9% |
| Immigrants | Bulgaria | 99.3 /100 | #46 | Exceptional 4.9% |
| Okinawans | 99.3 /100 | #47 | Exceptional 4.9% |
| Thais | 99.2 /100 | #48 | Exceptional 4.9% |
| Australians | 99.2 /100 | #49 | Exceptional 4.9% |
| Immigrants | Cuba | 99.1 /100 | #50 | Exceptional 4.9% |
| Cambodians | 99.1 /100 | #51 | Exceptional 4.9% |