Immigrants from Eastern Asia vs Trinidadian and Tobagonian Unemployment Among Ages 35 to 44 years
COMPARE
Immigrants from Eastern Asia
Trinidadian and Tobagonian
Unemployment Among Ages 35 to 44 years
Unemployment Among Ages 35 to 44 years Comparison
Immigrants from Eastern Asia
Trinidadians and Tobagonians
4.4%
UNEMPLOYMENT AMONG AGES 35 TO 44 YEARS
97.8/ 100
METRIC RATING
51st/ 347
METRIC RANK
5.6%
UNEMPLOYMENT AMONG AGES 35 TO 44 YEARS
0.0/ 100
METRIC RATING
294th/ 347
METRIC RANK
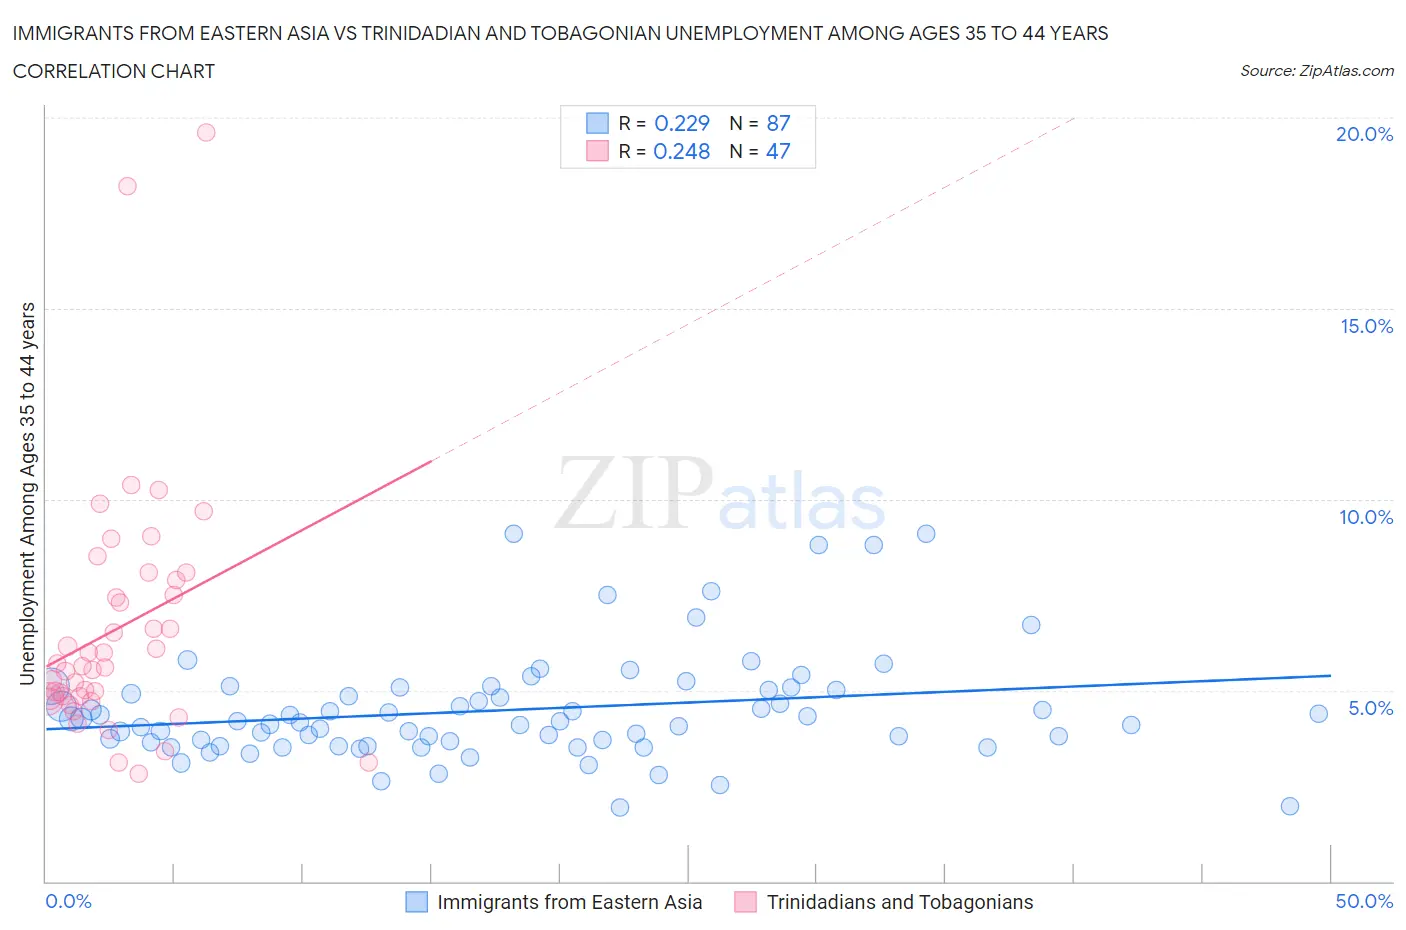
Immigrants from Eastern Asia vs Trinidadian and Tobagonian Unemployment Among Ages 35 to 44 years Correlation Chart
The statistical analysis conducted on geographies consisting of 481,023,005 people shows a weak positive correlation between the proportion of Immigrants from Eastern Asia and unemployment rate among population between the ages 35 and 44 in the United States with a correlation coefficient (R) of 0.229 and weighted average of 4.4%. Similarly, the statistical analysis conducted on geographies consisting of 217,589,291 people shows a weak positive correlation between the proportion of Trinidadians and Tobagonians and unemployment rate among population between the ages 35 and 44 in the United States with a correlation coefficient (R) of 0.248 and weighted average of 5.6%, a difference of 27.0%.
Unemployment Among Ages 35 to 44 years Correlation Summary
| Measurement | Immigrants from Eastern Asia | Trinidadian and Tobagonian |
| Minimum | 1.9% | 2.8% |
| Maximum | 9.1% | 19.6% |
| Range | 7.2% | 16.8% |
| Mean | 4.5% | 6.6% |
| Median | 4.2% | 5.6% |
| Interquartile 25% (IQ1) | 3.6% | 4.8% |
| Interquartile 75% (IQ3) | 5.0% | 7.9% |
| Interquartile Range (IQR) | 1.4% | 3.1% |
| Standard Deviation (Sample) | 1.4% | 3.3% |
| Standard Deviation (Population) | 1.4% | 3.2% |
Similar Demographics by Unemployment Among Ages 35 to 44 years
Demographics Similar to Immigrants from Eastern Asia by Unemployment Among Ages 35 to 44 years
In terms of unemployment among ages 35 to 44 years, the demographic groups most similar to Immigrants from Eastern Asia are Immigrants from Turkey (4.4%, a difference of 0.020%), Okinawan (4.4%, a difference of 0.020%), Immigrants from Argentina (4.4%, a difference of 0.16%), Asian (4.4%, a difference of 0.32%), and Immigrants from Moldova (4.4%, a difference of 0.35%).
| Demographics | Rating | Rank | Unemployment Among Ages 35 to 44 years |
| Immigrants | Malaysia | 98.7 /100 | #44 | Exceptional 4.3% |
| Immigrants | Korea | 98.4 /100 | #45 | Exceptional 4.3% |
| Immigrants | Belgium | 98.4 /100 | #46 | Exceptional 4.3% |
| British | 98.3 /100 | #47 | Exceptional 4.4% |
| Bhutanese | 98.2 /100 | #48 | Exceptional 4.4% |
| Swiss | 98.2 /100 | #49 | Exceptional 4.4% |
| Immigrants | Turkey | 97.8 /100 | #50 | Exceptional 4.4% |
| Immigrants | Eastern Asia | 97.8 /100 | #51 | Exceptional 4.4% |
| Okinawans | 97.7 /100 | #52 | Exceptional 4.4% |
| Immigrants | Argentina | 97.6 /100 | #53 | Exceptional 4.4% |
| Asians | 97.4 /100 | #54 | Exceptional 4.4% |
| Immigrants | Moldova | 97.3 /100 | #55 | Exceptional 4.4% |
| Chileans | 97.3 /100 | #56 | Exceptional 4.4% |
| Immigrants | Hong Kong | 97.2 /100 | #57 | Exceptional 4.4% |
| English | 97.2 /100 | #58 | Exceptional 4.4% |
Demographics Similar to Trinidadians and Tobagonians by Unemployment Among Ages 35 to 44 years
In terms of unemployment among ages 35 to 44 years, the demographic groups most similar to Trinidadians and Tobagonians are Central American Indian (5.6%, a difference of 0.010%), Ottawa (5.6%, a difference of 0.22%), Immigrants from Haiti (5.5%, a difference of 0.23%), Immigrants from Trinidad and Tobago (5.6%, a difference of 0.23%), and U.S. Virgin Islander (5.6%, a difference of 0.34%).
| Demographics | Rating | Rank | Unemployment Among Ages 35 to 44 years |
| French American Indians | 0.0 /100 | #287 | Tragic 5.5% |
| Cree | 0.0 /100 | #288 | Tragic 5.5% |
| Spanish American Indians | 0.0 /100 | #289 | Tragic 5.5% |
| Jamaicans | 0.0 /100 | #290 | Tragic 5.5% |
| Dutch West Indians | 0.0 /100 | #291 | Tragic 5.5% |
| Immigrants | Haiti | 0.0 /100 | #292 | Tragic 5.5% |
| Central American Indians | 0.0 /100 | #293 | Tragic 5.6% |
| Trinidadians and Tobagonians | 0.0 /100 | #294 | Tragic 5.6% |
| Ottawa | 0.0 /100 | #295 | Tragic 5.6% |
| Immigrants | Trinidad and Tobago | 0.0 /100 | #296 | Tragic 5.6% |
| U.S. Virgin Islanders | 0.0 /100 | #297 | Tragic 5.6% |
| Aleuts | 0.0 /100 | #298 | Tragic 5.6% |
| Immigrants | Jamaica | 0.0 /100 | #299 | Tragic 5.6% |
| Immigrants | West Indies | 0.0 /100 | #300 | Tragic 5.6% |
| Africans | 0.0 /100 | #301 | Tragic 5.6% |