Black/African American vs Trinidadian and Tobagonian Unemployment Among Ages 35 to 44 years
COMPARE
Black/African American
Trinidadian and Tobagonian
Unemployment Among Ages 35 to 44 years
Unemployment Among Ages 35 to 44 years Comparison
Blacks/African Americans
Trinidadians and Tobagonians
6.1%
UNEMPLOYMENT AMONG AGES 35 TO 44 YEARS
0.0/ 100
METRIC RATING
315th/ 347
METRIC RANK
5.6%
UNEMPLOYMENT AMONG AGES 35 TO 44 YEARS
0.0/ 100
METRIC RATING
294th/ 347
METRIC RANK
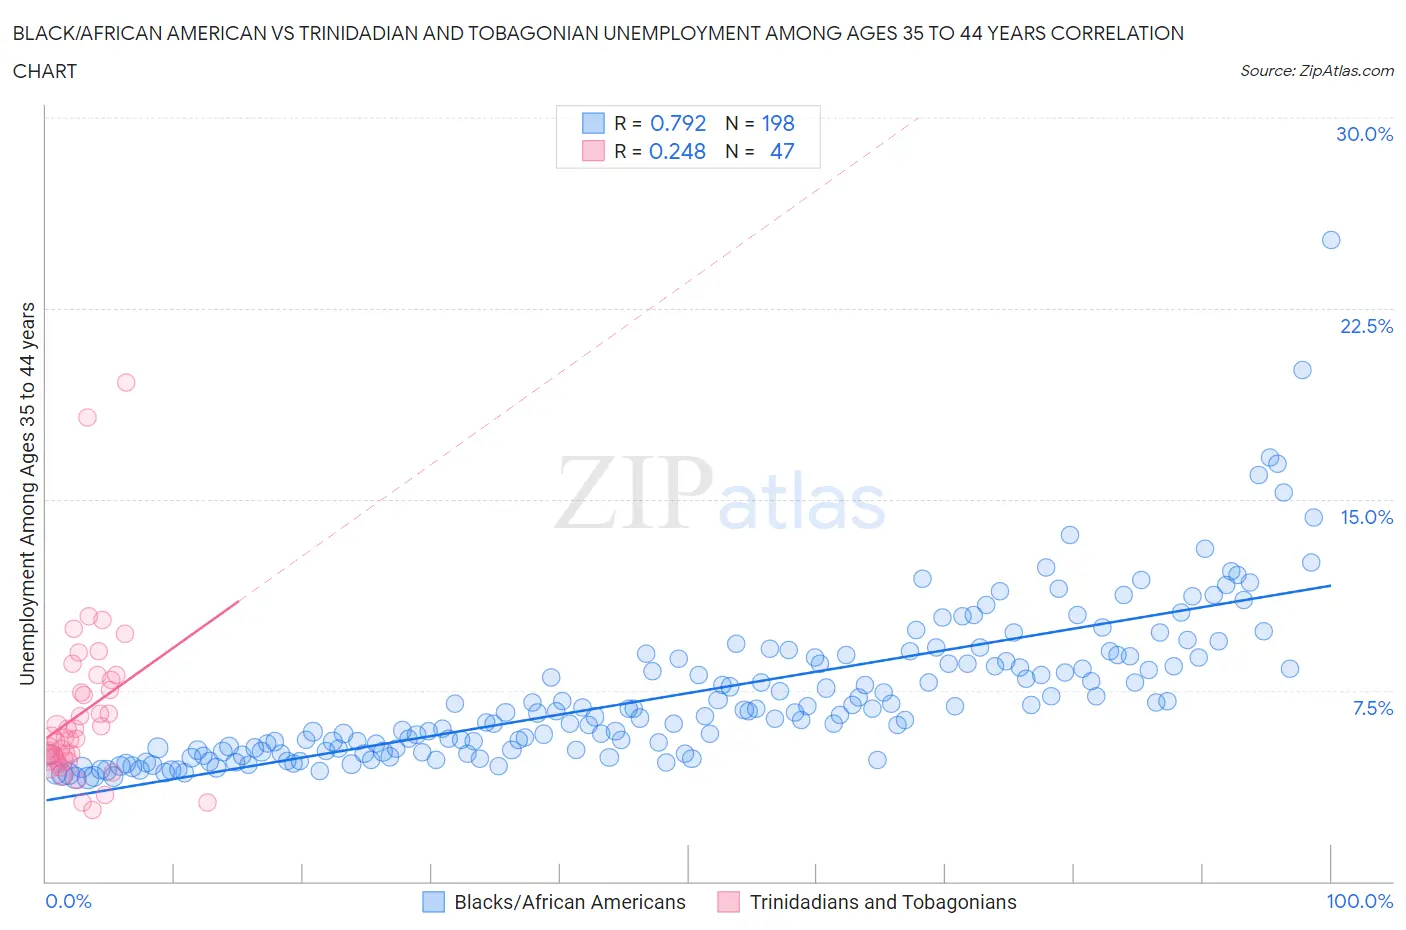
Black/African American vs Trinidadian and Tobagonian Unemployment Among Ages 35 to 44 years Correlation Chart
The statistical analysis conducted on geographies consisting of 531,599,324 people shows a strong positive correlation between the proportion of Blacks/African Americans and unemployment rate among population between the ages 35 and 44 in the United States with a correlation coefficient (R) of 0.792 and weighted average of 6.1%. Similarly, the statistical analysis conducted on geographies consisting of 217,589,291 people shows a weak positive correlation between the proportion of Trinidadians and Tobagonians and unemployment rate among population between the ages 35 and 44 in the United States with a correlation coefficient (R) of 0.248 and weighted average of 5.6%, a difference of 9.8%.
Unemployment Among Ages 35 to 44 years Correlation Summary
| Measurement | Black/African American | Trinidadian and Tobagonian |
| Minimum | 4.1% | 2.8% |
| Maximum | 25.2% | 19.6% |
| Range | 21.1% | 16.8% |
| Mean | 7.4% | 6.6% |
| Median | 6.6% | 5.6% |
| Interquartile 25% (IQ1) | 5.1% | 4.8% |
| Interquartile 75% (IQ3) | 8.7% | 7.9% |
| Interquartile Range (IQR) | 3.6% | 3.1% |
| Standard Deviation (Sample) | 3.1% | 3.3% |
| Standard Deviation (Population) | 3.0% | 3.2% |
Similar Demographics by Unemployment Among Ages 35 to 44 years
Demographics Similar to Blacks/African Americans by Unemployment Among Ages 35 to 44 years
In terms of unemployment among ages 35 to 44 years, the demographic groups most similar to Blacks/African Americans are Tsimshian (6.2%, a difference of 0.85%), Immigrants from St. Vincent and the Grenadines (6.2%, a difference of 1.0%), Colville (6.2%, a difference of 1.5%), Immigrants from Grenada (6.2%, a difference of 1.7%), and Immigrants from Dominica (6.0%, a difference of 1.8%).
| Demographics | Rating | Rank | Unemployment Among Ages 35 to 44 years |
| Immigrants | Azores | 0.0 /100 | #308 | Tragic 5.8% |
| Immigrants | Barbados | 0.0 /100 | #309 | Tragic 5.8% |
| Guyanese | 0.0 /100 | #310 | Tragic 5.9% |
| Marshallese | 0.0 /100 | #311 | Tragic 5.9% |
| Immigrants | Guyana | 0.0 /100 | #312 | Tragic 6.0% |
| British West Indians | 0.0 /100 | #313 | Tragic 6.0% |
| Immigrants | Dominica | 0.0 /100 | #314 | Tragic 6.0% |
| Blacks/African Americans | 0.0 /100 | #315 | Tragic 6.1% |
| Tsimshian | 0.0 /100 | #316 | Tragic 6.2% |
| Immigrants | St. Vincent and the Grenadines | 0.0 /100 | #317 | Tragic 6.2% |
| Colville | 0.0 /100 | #318 | Tragic 6.2% |
| Immigrants | Grenada | 0.0 /100 | #319 | Tragic 6.2% |
| Immigrants | Armenia | 0.0 /100 | #320 | Tragic 6.2% |
| Chippewa | 0.0 /100 | #321 | Tragic 6.2% |
| Immigrants | Dominican Republic | 0.0 /100 | #322 | Tragic 6.4% |
Demographics Similar to Trinidadians and Tobagonians by Unemployment Among Ages 35 to 44 years
In terms of unemployment among ages 35 to 44 years, the demographic groups most similar to Trinidadians and Tobagonians are Central American Indian (5.6%, a difference of 0.010%), Ottawa (5.6%, a difference of 0.22%), Immigrants from Haiti (5.5%, a difference of 0.23%), Immigrants from Trinidad and Tobago (5.6%, a difference of 0.23%), and U.S. Virgin Islander (5.6%, a difference of 0.34%).
| Demographics | Rating | Rank | Unemployment Among Ages 35 to 44 years |
| French American Indians | 0.0 /100 | #287 | Tragic 5.5% |
| Cree | 0.0 /100 | #288 | Tragic 5.5% |
| Spanish American Indians | 0.0 /100 | #289 | Tragic 5.5% |
| Jamaicans | 0.0 /100 | #290 | Tragic 5.5% |
| Dutch West Indians | 0.0 /100 | #291 | Tragic 5.5% |
| Immigrants | Haiti | 0.0 /100 | #292 | Tragic 5.5% |
| Central American Indians | 0.0 /100 | #293 | Tragic 5.6% |
| Trinidadians and Tobagonians | 0.0 /100 | #294 | Tragic 5.6% |
| Ottawa | 0.0 /100 | #295 | Tragic 5.6% |
| Immigrants | Trinidad and Tobago | 0.0 /100 | #296 | Tragic 5.6% |
| U.S. Virgin Islanders | 0.0 /100 | #297 | Tragic 5.6% |
| Aleuts | 0.0 /100 | #298 | Tragic 5.6% |
| Immigrants | Jamaica | 0.0 /100 | #299 | Tragic 5.6% |
| Immigrants | West Indies | 0.0 /100 | #300 | Tragic 5.6% |
| Africans | 0.0 /100 | #301 | Tragic 5.6% |