Pima vs Immigrants from Yemen Unemployment Among Ages 35 to 44 years
COMPARE
Pima
Immigrants from Yemen
Unemployment Among Ages 35 to 44 years
Unemployment Among Ages 35 to 44 years Comparison
Pima
Immigrants from Yemen
11.8%
UNEMPLOYMENT AMONG AGES 35 TO 44 YEARS
0.0/ 100
METRIC RATING
344th/ 347
METRIC RANK
6.6%
UNEMPLOYMENT AMONG AGES 35 TO 44 YEARS
0.0/ 100
METRIC RATING
325th/ 347
METRIC RANK
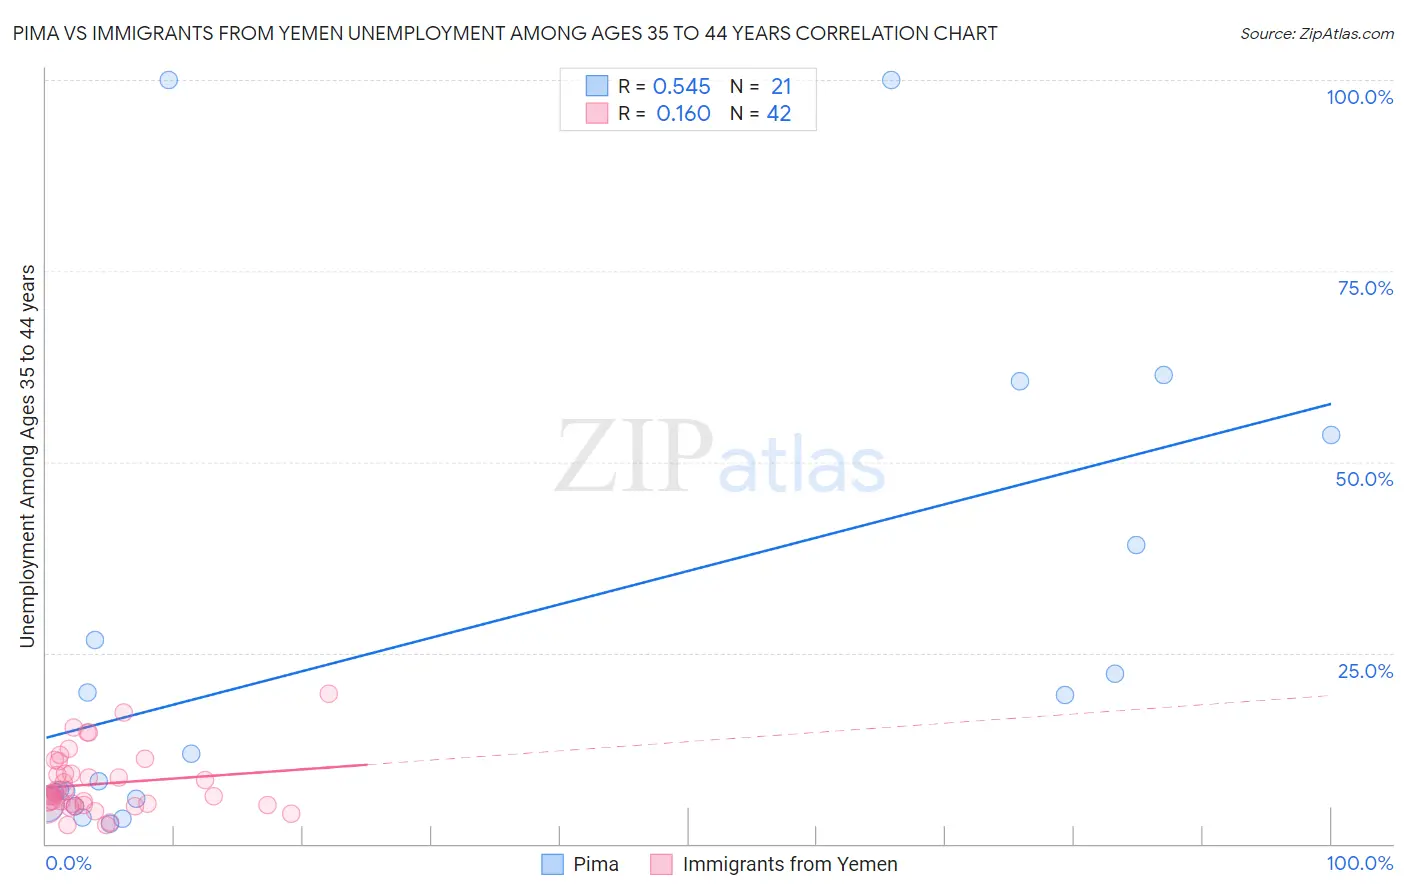
Pima vs Immigrants from Yemen Unemployment Among Ages 35 to 44 years Correlation Chart
The statistical analysis conducted on geographies consisting of 61,252,012 people shows a substantial positive correlation between the proportion of Pima and unemployment rate among population between the ages 35 and 44 in the United States with a correlation coefficient (R) of 0.545 and weighted average of 11.8%. Similarly, the statistical analysis conducted on geographies consisting of 82,232,966 people shows a poor positive correlation between the proportion of Immigrants from Yemen and unemployment rate among population between the ages 35 and 44 in the United States with a correlation coefficient (R) of 0.160 and weighted average of 6.6%, a difference of 79.4%.
Unemployment Among Ages 35 to 44 years Correlation Summary
| Measurement | Pima | Immigrants from Yemen |
| Minimum | 2.7% | 2.5% |
| Maximum | 100.0% | 19.6% |
| Range | 97.3% | 17.1% |
| Mean | 27.1% | 7.8% |
| Median | 11.8% | 6.5% |
| Interquartile 25% (IQ1) | 5.6% | 5.1% |
| Interquartile 75% (IQ3) | 46.3% | 9.2% |
| Interquartile Range (IQR) | 40.7% | 4.1% |
| Standard Deviation (Sample) | 30.7% | 4.0% |
| Standard Deviation (Population) | 30.0% | 3.9% |
Demographics Similar to Pima and Immigrants from Yemen by Unemployment Among Ages 35 to 44 years
In terms of unemployment among ages 35 to 44 years, the demographic groups most similar to Pima are Arapaho (10.3%, a difference of 14.3%), Navajo (9.3%, a difference of 25.9%), Hopi (8.9%, a difference of 32.4%), Alaskan Athabascan (8.6%, a difference of 36.3%), and Inupiat (8.6%, a difference of 37.2%). Similarly, the demographic groups most similar to Immigrants from Yemen are Alaska Native (6.6%, a difference of 0.070%), Cape Verdean (6.6%, a difference of 0.12%), Menominee (6.5%, a difference of 0.36%), Shoshone (6.6%, a difference of 0.81%), and Paiute (6.9%, a difference of 4.9%).
| Demographics | Rating | Rank | Unemployment Among Ages 35 to 44 years |
| Menominee | 0.0 /100 | #324 | Tragic 6.5% |
| Immigrants | Yemen | 0.0 /100 | #325 | Tragic 6.6% |
| Alaska Natives | 0.0 /100 | #326 | Tragic 6.6% |
| Cape Verdeans | 0.0 /100 | #327 | Tragic 6.6% |
| Shoshone | 0.0 /100 | #328 | Tragic 6.6% |
| Paiute | 0.0 /100 | #329 | Tragic 6.9% |
| Immigrants | Cabo Verde | 0.0 /100 | #330 | Tragic 6.9% |
| Pueblo | 0.0 /100 | #331 | Tragic 7.1% |
| Natives/Alaskans | 0.0 /100 | #332 | Tragic 7.3% |
| Puerto Ricans | 0.0 /100 | #333 | Tragic 7.6% |
| Houma | 0.0 /100 | #334 | Tragic 7.8% |
| Sioux | 0.0 /100 | #335 | Tragic 8.4% |
| Apache | 0.0 /100 | #336 | Tragic 8.4% |
| Tohono O'odham | 0.0 /100 | #337 | Tragic 8.4% |
| Cheyenne | 0.0 /100 | #338 | Tragic 8.5% |
| Inupiat | 0.0 /100 | #339 | Tragic 8.6% |
| Alaskan Athabascans | 0.0 /100 | #340 | Tragic 8.6% |
| Hopi | 0.0 /100 | #341 | Tragic 8.9% |
| Navajo | 0.0 /100 | #342 | Tragic 9.3% |
| Arapaho | 0.0 /100 | #343 | Tragic 10.3% |
| Pima | 0.0 /100 | #344 | Tragic 11.8% |