Paraguayan vs Immigrants from Denmark Unemployment Among Women with Children Ages 6 to 17 years
COMPARE
Paraguayan
Immigrants from Denmark
Unemployment Among Women with Children Ages 6 to 17 years
Unemployment Among Women with Children Ages 6 to 17 years Comparison
Paraguayans
Immigrants from Denmark
10.2%
UNEMPLOYMENT AMONG WOMEN WITH CHILDREN AGES 6 TO 17 YEARS
0.0/ 100
METRIC RATING
306th/ 347
METRIC RANK
8.7%
UNEMPLOYMENT AMONG WOMEN WITH CHILDREN AGES 6 TO 17 YEARS
95.5/ 100
METRIC RATING
121st/ 347
METRIC RANK
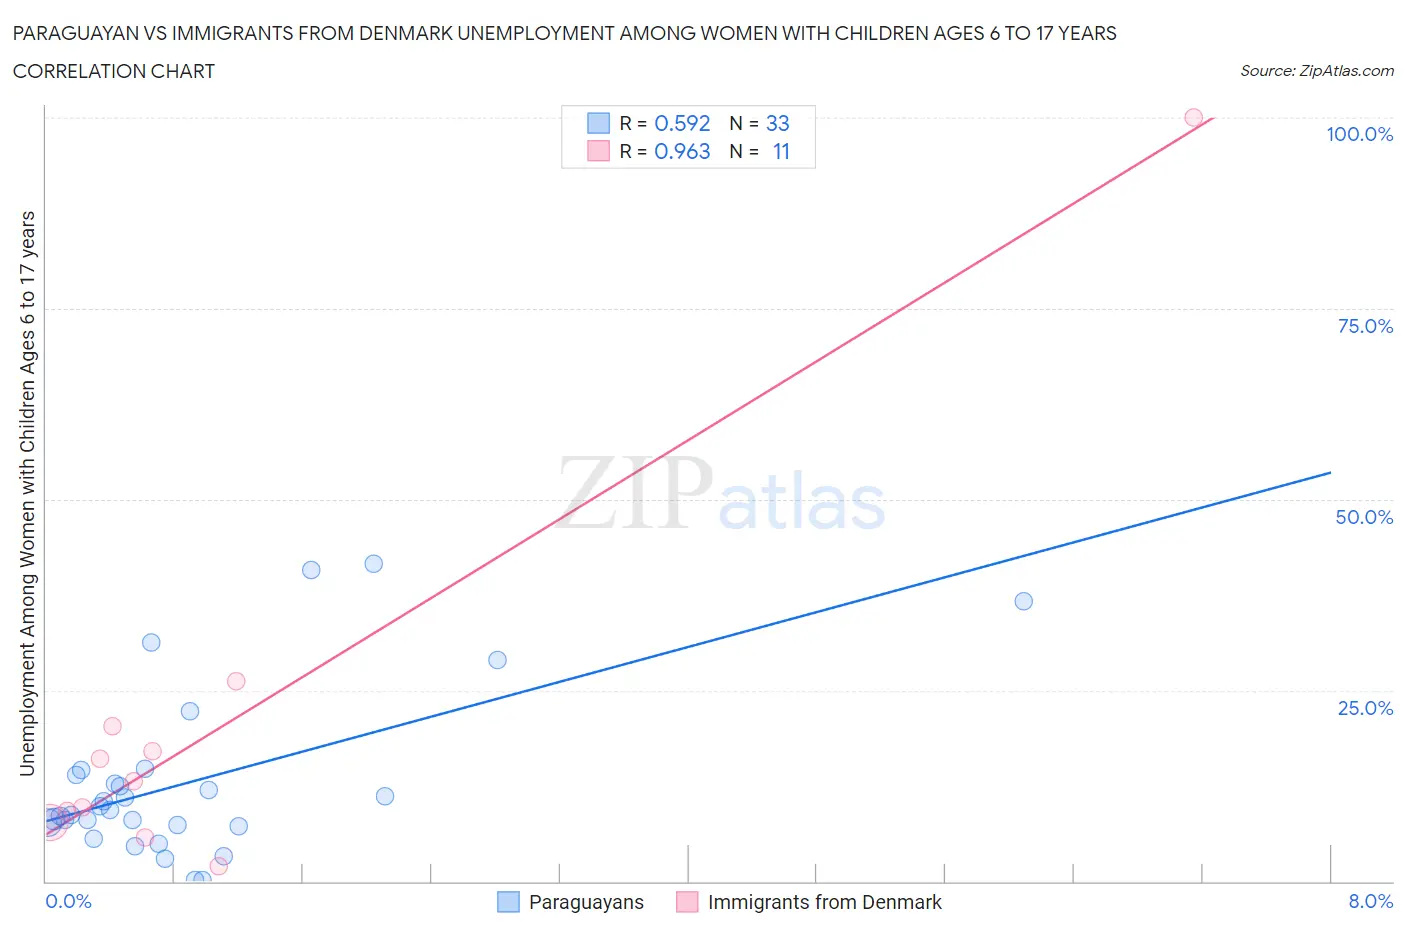
Paraguayan vs Immigrants from Denmark Unemployment Among Women with Children Ages 6 to 17 years Correlation Chart
The statistical analysis conducted on geographies consisting of 81,717,447 people shows a substantial positive correlation between the proportion of Paraguayans and unemployment rate among women with children between the ages 6 and 17 in the United States with a correlation coefficient (R) of 0.592 and weighted average of 10.2%. Similarly, the statistical analysis conducted on geographies consisting of 113,144,957 people shows a perfect positive correlation between the proportion of Immigrants from Denmark and unemployment rate among women with children between the ages 6 and 17 in the United States with a correlation coefficient (R) of 0.963 and weighted average of 8.7%, a difference of 18.0%.
Unemployment Among Women with Children Ages 6 to 17 years Correlation Summary
| Measurement | Paraguayan | Immigrants from Denmark |
| Minimum | 0.10% | 2.0% |
| Maximum | 41.5% | 100.0% |
| Range | 41.4% | 98.0% |
| Mean | 12.9% | 20.6% |
| Median | 9.4% | 13.1% |
| Interquartile 25% (IQ1) | 7.2% | 7.7% |
| Interquartile 75% (IQ3) | 14.3% | 20.3% |
| Interquartile Range (IQR) | 7.0% | 12.6% |
| Standard Deviation (Sample) | 10.9% | 27.2% |
| Standard Deviation (Population) | 10.7% | 26.0% |
Similar Demographics by Unemployment Among Women with Children Ages 6 to 17 years
Demographics Similar to Paraguayans by Unemployment Among Women with Children Ages 6 to 17 years
In terms of unemployment among women with children ages 6 to 17 years, the demographic groups most similar to Paraguayans are Immigrants from Senegal (10.2%, a difference of 0.23%), Dutch West Indian (10.2%, a difference of 0.24%), Immigrants from Nigeria (10.2%, a difference of 0.29%), Immigrants from Venezuela (10.2%, a difference of 0.35%), and Immigrants from Ecuador (10.2%, a difference of 0.44%).
| Demographics | Rating | Rank | Unemployment Among Women with Children Ages 6 to 17 years |
| Immigrants | Honduras | 0.0 /100 | #299 | Tragic 10.1% |
| Nigerians | 0.0 /100 | #300 | Tragic 10.1% |
| Immigrants | Bahamas | 0.0 /100 | #301 | Tragic 10.1% |
| Venezuelans | 0.0 /100 | #302 | Tragic 10.2% |
| Immigrants | Ecuador | 0.0 /100 | #303 | Tragic 10.2% |
| Immigrants | Venezuela | 0.0 /100 | #304 | Tragic 10.2% |
| Immigrants | Nigeria | 0.0 /100 | #305 | Tragic 10.2% |
| Paraguayans | 0.0 /100 | #306 | Tragic 10.2% |
| Immigrants | Senegal | 0.0 /100 | #307 | Tragic 10.2% |
| Dutch West Indians | 0.0 /100 | #308 | Tragic 10.2% |
| French Canadians | 0.0 /100 | #309 | Tragic 10.3% |
| Alaska Natives | 0.0 /100 | #310 | Tragic 10.3% |
| Immigrants | Liberia | 0.0 /100 | #311 | Tragic 10.3% |
| Africans | 0.0 /100 | #312 | Tragic 10.4% |
| Americans | 0.0 /100 | #313 | Tragic 10.4% |
Demographics Similar to Immigrants from Denmark by Unemployment Among Women with Children Ages 6 to 17 years
In terms of unemployment among women with children ages 6 to 17 years, the demographic groups most similar to Immigrants from Denmark are Israeli (8.7%, a difference of 0.11%), Immigrants from Egypt (8.7%, a difference of 0.12%), Immigrants from Morocco (8.7%, a difference of 0.16%), Immigrants from Lebanon (8.7%, a difference of 0.16%), and Immigrants from Grenada (8.6%, a difference of 0.19%).
| Demographics | Rating | Rank | Unemployment Among Women with Children Ages 6 to 17 years |
| Immigrants | Russia | 96.7 /100 | #114 | Exceptional 8.6% |
| Argentineans | 96.5 /100 | #115 | Exceptional 8.6% |
| Zimbabweans | 96.3 /100 | #116 | Exceptional 8.6% |
| Albanians | 96.3 /100 | #117 | Exceptional 8.6% |
| Pueblo | 96.2 /100 | #118 | Exceptional 8.6% |
| Immigrants | Grenada | 96.2 /100 | #119 | Exceptional 8.6% |
| Israelis | 95.9 /100 | #120 | Exceptional 8.7% |
| Immigrants | Denmark | 95.5 /100 | #121 | Exceptional 8.7% |
| Immigrants | Egypt | 95.0 /100 | #122 | Exceptional 8.7% |
| Immigrants | Morocco | 94.9 /100 | #123 | Exceptional 8.7% |
| Immigrants | Lebanon | 94.9 /100 | #124 | Exceptional 8.7% |
| South Africans | 94.6 /100 | #125 | Exceptional 8.7% |
| Immigrants | Northern Africa | 94.4 /100 | #126 | Exceptional 8.7% |
| Czechs | 94.4 /100 | #127 | Exceptional 8.7% |
| Hmong | 94.3 /100 | #128 | Exceptional 8.7% |