Chinese vs Kiowa Male Unemployment
COMPARE
Chinese
Kiowa
Male Unemployment
Male Unemployment Comparison
Chinese
Kiowa
4.9%
MALE UNEMPLOYMENT
99.3/ 100
METRIC RATING
41st/ 347
METRIC RANK
5.8%
MALE UNEMPLOYMENT
0.2/ 100
METRIC RATING
255th/ 347
METRIC RANK
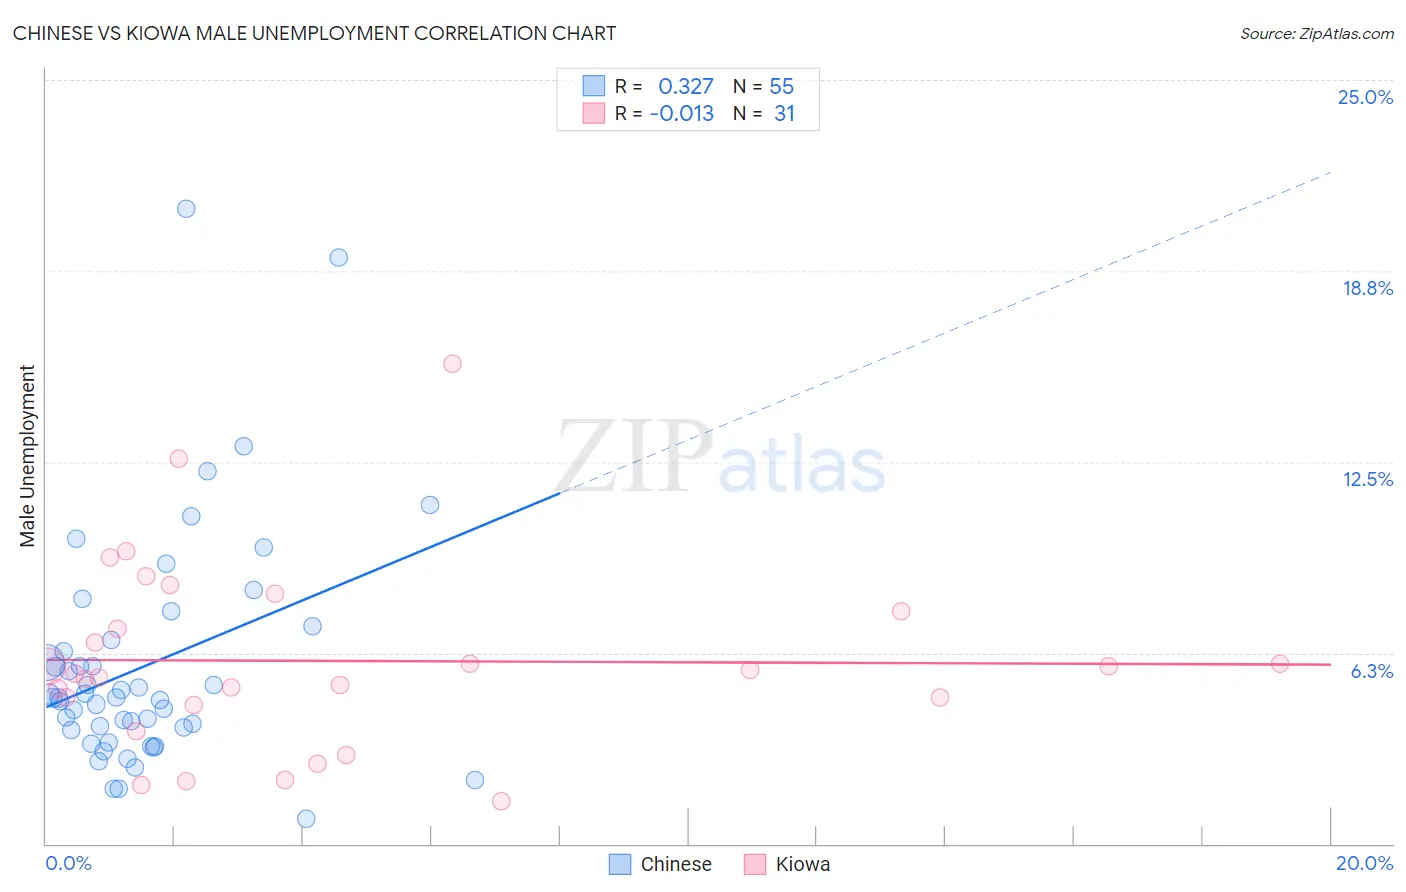
Chinese vs Kiowa Male Unemployment Correlation Chart
The statistical analysis conducted on geographies consisting of 64,756,701 people shows a mild positive correlation between the proportion of Chinese and unemployment rate among males in the United States with a correlation coefficient (R) of 0.327 and weighted average of 4.9%. Similarly, the statistical analysis conducted on geographies consisting of 56,015,604 people shows no correlation between the proportion of Kiowa and unemployment rate among males in the United States with a correlation coefficient (R) of -0.013 and weighted average of 5.8%, a difference of 17.7%.
Male Unemployment Correlation Summary
| Measurement | Chinese | Kiowa |
| Minimum | 0.80% | 1.4% |
| Maximum | 20.8% | 15.7% |
| Range | 20.0% | 14.3% |
| Mean | 5.8% | 6.0% |
| Median | 4.8% | 5.6% |
| Interquartile 25% (IQ1) | 3.7% | 4.5% |
| Interquartile 75% (IQ3) | 6.7% | 7.6% |
| Interquartile Range (IQR) | 2.9% | 3.1% |
| Standard Deviation (Sample) | 3.8% | 3.1% |
| Standard Deviation (Population) | 3.8% | 3.0% |
Similar Demographics by Male Unemployment
Demographics Similar to Chinese by Male Unemployment
In terms of male unemployment, the demographic groups most similar to Chinese are Immigrants from Belgium (4.9%, a difference of 0.020%), Northern European (4.9%, a difference of 0.080%), Immigrants from Japan (4.9%, a difference of 0.13%), Burmese (4.9%, a difference of 0.17%), and Immigrants from Bosnia and Herzegovina (4.9%, a difference of 0.24%).
| Demographics | Rating | Rank | Male Unemployment |
| Welsh | 99.7 /100 | #34 | Exceptional 4.8% |
| Paraguayans | 99.5 /100 | #35 | Exceptional 4.9% |
| Immigrants | Singapore | 99.4 /100 | #36 | Exceptional 4.9% |
| Scotch-Irish | 99.4 /100 | #37 | Exceptional 4.9% |
| Immigrants | Bosnia and Herzegovina | 99.4 /100 | #38 | Exceptional 4.9% |
| Burmese | 99.3 /100 | #39 | Exceptional 4.9% |
| Northern Europeans | 99.3 /100 | #40 | Exceptional 4.9% |
| Chinese | 99.3 /100 | #41 | Exceptional 4.9% |
| Immigrants | Belgium | 99.2 /100 | #42 | Exceptional 4.9% |
| Immigrants | Japan | 99.2 /100 | #43 | Exceptional 4.9% |
| Immigrants | Korea | 99.1 /100 | #44 | Exceptional 4.9% |
| Immigrants | Zimbabwe | 99.0 /100 | #45 | Exceptional 4.9% |
| Bhutanese | 98.9 /100 | #46 | Exceptional 4.9% |
| Austrians | 98.9 /100 | #47 | Exceptional 4.9% |
| Immigrants | Scotland | 98.9 /100 | #48 | Exceptional 4.9% |
Demographics Similar to Kiowa by Male Unemployment
In terms of male unemployment, the demographic groups most similar to Kiowa are Comanche (5.8%, a difference of 0.080%), Japanese (5.8%, a difference of 0.10%), Hispanic or Latino (5.8%, a difference of 0.25%), Mexican American Indian (5.8%, a difference of 0.28%), and Dutch West Indian (5.8%, a difference of 0.38%).
| Demographics | Rating | Rank | Male Unemployment |
| Marshallese | 0.5 /100 | #248 | Tragic 5.7% |
| Cree | 0.4 /100 | #249 | Tragic 5.7% |
| Immigrants | Bahamas | 0.4 /100 | #250 | Tragic 5.7% |
| Spanish Americans | 0.3 /100 | #251 | Tragic 5.7% |
| Mexicans | 0.2 /100 | #252 | Tragic 5.8% |
| Mexican American Indians | 0.2 /100 | #253 | Tragic 5.8% |
| Japanese | 0.2 /100 | #254 | Tragic 5.8% |
| Kiowa | 0.2 /100 | #255 | Tragic 5.8% |
| Comanche | 0.2 /100 | #256 | Tragic 5.8% |
| Hispanics or Latinos | 0.1 /100 | #257 | Tragic 5.8% |
| Dutch West Indians | 0.1 /100 | #258 | Tragic 5.8% |
| Cajuns | 0.1 /100 | #259 | Tragic 5.8% |
| Immigrants | Central America | 0.1 /100 | #260 | Tragic 5.8% |
| Liberians | 0.1 /100 | #261 | Tragic 5.8% |
| Immigrants | Portugal | 0.1 /100 | #262 | Tragic 5.9% |