Pakistani vs Jordanian Unemployment Among Women with Children Under 6 years
COMPARE
Pakistani
Jordanian
Unemployment Among Women with Children Under 6 years
Unemployment Among Women with Children Under 6 years Comparison
Pakistanis
Jordanians
7.3%
UNEMPLOYMENT AMONG WOMEN WITH CHILDREN UNDER 6 YEARS
92.2/ 100
METRIC RATING
125th/ 347
METRIC RANK
7.3%
UNEMPLOYMENT AMONG WOMEN WITH CHILDREN UNDER 6 YEARS
91.5/ 100
METRIC RATING
127th/ 347
METRIC RANK
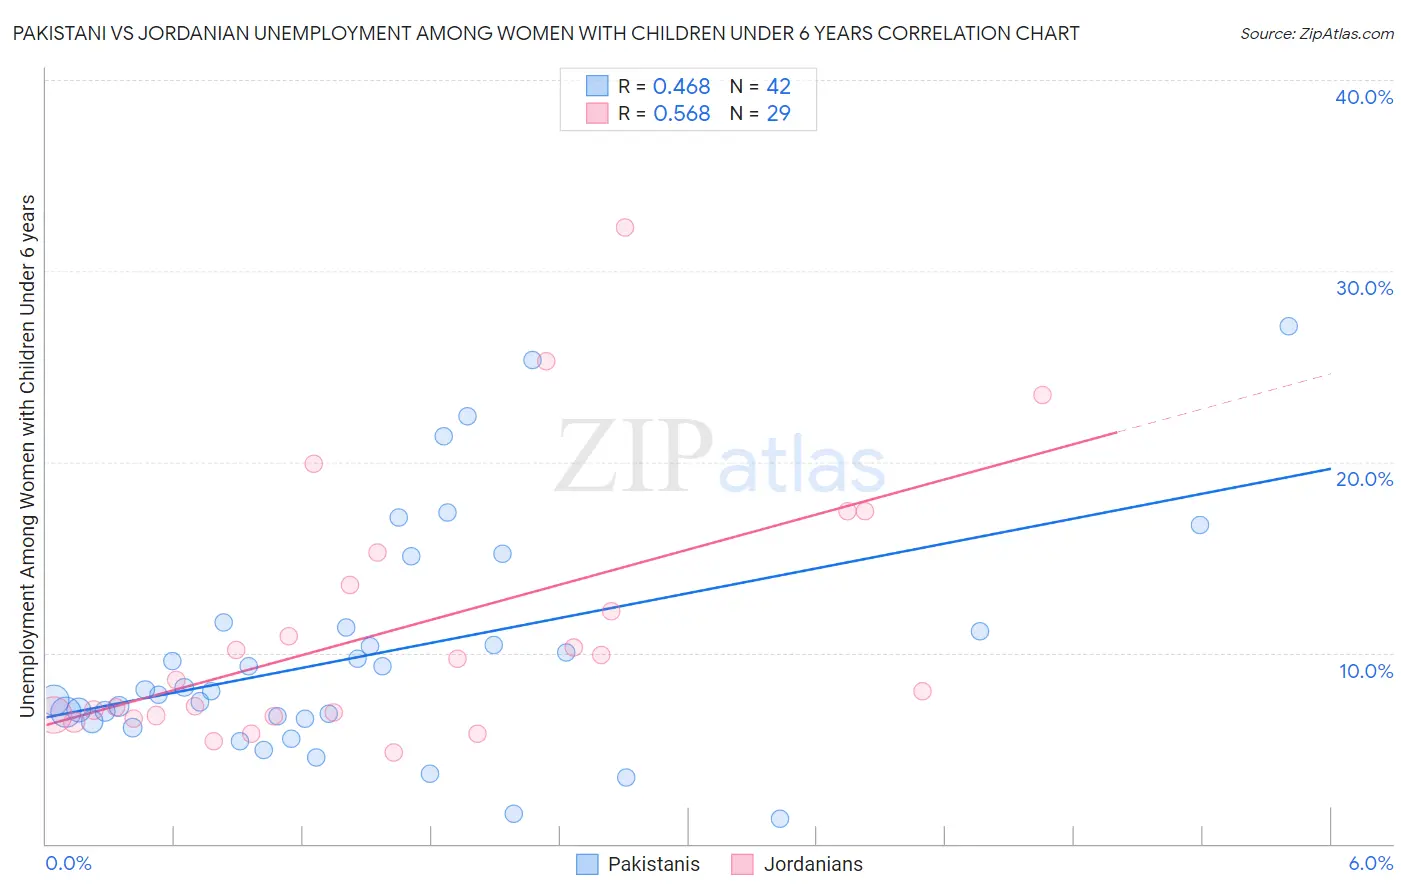
Pakistani vs Jordanian Unemployment Among Women with Children Under 6 years Correlation Chart
The statistical analysis conducted on geographies consisting of 266,898,941 people shows a moderate positive correlation between the proportion of Pakistanis and unemployment rate among women with children under the age of 6 in the United States with a correlation coefficient (R) of 0.468 and weighted average of 7.3%. Similarly, the statistical analysis conducted on geographies consisting of 146,717,249 people shows a substantial positive correlation between the proportion of Jordanians and unemployment rate among women with children under the age of 6 in the United States with a correlation coefficient (R) of 0.568 and weighted average of 7.3%, a difference of 0.16%.
Unemployment Among Women with Children Under 6 years Correlation Summary
| Measurement | Pakistani | Jordanian |
| Minimum | 1.3% | 4.8% |
| Maximum | 27.1% | 32.3% |
| Range | 25.8% | 27.5% |
| Mean | 10.0% | 11.3% |
| Median | 8.0% | 8.6% |
| Interquartile 25% (IQ1) | 6.5% | 6.7% |
| Interquartile 75% (IQ3) | 11.3% | 14.4% |
| Interquartile Range (IQR) | 4.8% | 7.7% |
| Standard Deviation (Sample) | 6.0% | 6.8% |
| Standard Deviation (Population) | 5.9% | 6.7% |
Demographics Similar to Pakistanis and Jordanians by Unemployment Among Women with Children Under 6 years
In terms of unemployment among women with children under 6 years, the demographic groups most similar to Pakistanis are Immigrants from Burma/Myanmar (7.3%, a difference of 0.070%), Immigrants from South Africa (7.3%, a difference of 0.080%), Zimbabwean (7.3%, a difference of 0.17%), Immigrants from Zaire (7.3%, a difference of 0.28%), and Immigrants from Bosnia and Herzegovina (7.3%, a difference of 0.33%). Similarly, the demographic groups most similar to Jordanians are Zimbabwean (7.3%, a difference of 0.0%), Immigrants from Burma/Myanmar (7.3%, a difference of 0.10%), Immigrants from South Africa (7.3%, a difference of 0.25%), Immigrants from Zaire (7.3%, a difference of 0.44%), and Slovene (7.4%, a difference of 0.45%).
| Demographics | Rating | Rank | Unemployment Among Women with Children Under 6 years |
| Armenians | 95.9 /100 | #116 | Exceptional 7.2% |
| Immigrants | Kenya | 95.4 /100 | #117 | Exceptional 7.3% |
| Serbians | 94.5 /100 | #118 | Exceptional 7.3% |
| South Africans | 94.1 /100 | #119 | Exceptional 7.3% |
| Iraqis | 93.9 /100 | #120 | Exceptional 7.3% |
| Immigrants | Chile | 93.5 /100 | #121 | Exceptional 7.3% |
| Immigrants | Bosnia and Herzegovina | 93.5 /100 | #122 | Exceptional 7.3% |
| Immigrants | Zaire | 93.3 /100 | #123 | Exceptional 7.3% |
| Immigrants | South Africa | 92.5 /100 | #124 | Exceptional 7.3% |
| Pakistanis | 92.2 /100 | #125 | Exceptional 7.3% |
| Immigrants | Burma/Myanmar | 91.9 /100 | #126 | Exceptional 7.3% |
| Jordanians | 91.5 /100 | #127 | Exceptional 7.3% |
| Zimbabweans | 91.5 /100 | #128 | Exceptional 7.3% |
| Slovenes | 89.2 /100 | #129 | Excellent 7.4% |
| Swedes | 88.4 /100 | #130 | Excellent 7.4% |
| Ukrainians | 88.2 /100 | #131 | Excellent 7.4% |
| Immigrants | Armenia | 87.4 /100 | #132 | Excellent 7.4% |
| Immigrants | Uganda | 86.5 /100 | #133 | Excellent 7.4% |
| Immigrants | Bolivia | 85.7 /100 | #134 | Excellent 7.4% |
| Immigrants | Northern Africa | 85.3 /100 | #135 | Excellent 7.4% |
| Immigrants | Morocco | 84.9 /100 | #136 | Excellent 7.4% |