Pakistani vs Immigrants from Argentina Unemployment Among Women with Children Under 6 years
COMPARE
Pakistani
Immigrants from Argentina
Unemployment Among Women with Children Under 6 years
Unemployment Among Women with Children Under 6 years Comparison
Pakistanis
Immigrants from Argentina
7.3%
UNEMPLOYMENT AMONG WOMEN WITH CHILDREN UNDER 6 YEARS
92.2/ 100
METRIC RATING
125th/ 347
METRIC RANK
7.5%
UNEMPLOYMENT AMONG WOMEN WITH CHILDREN UNDER 6 YEARS
81.5/ 100
METRIC RATING
142nd/ 347
METRIC RANK
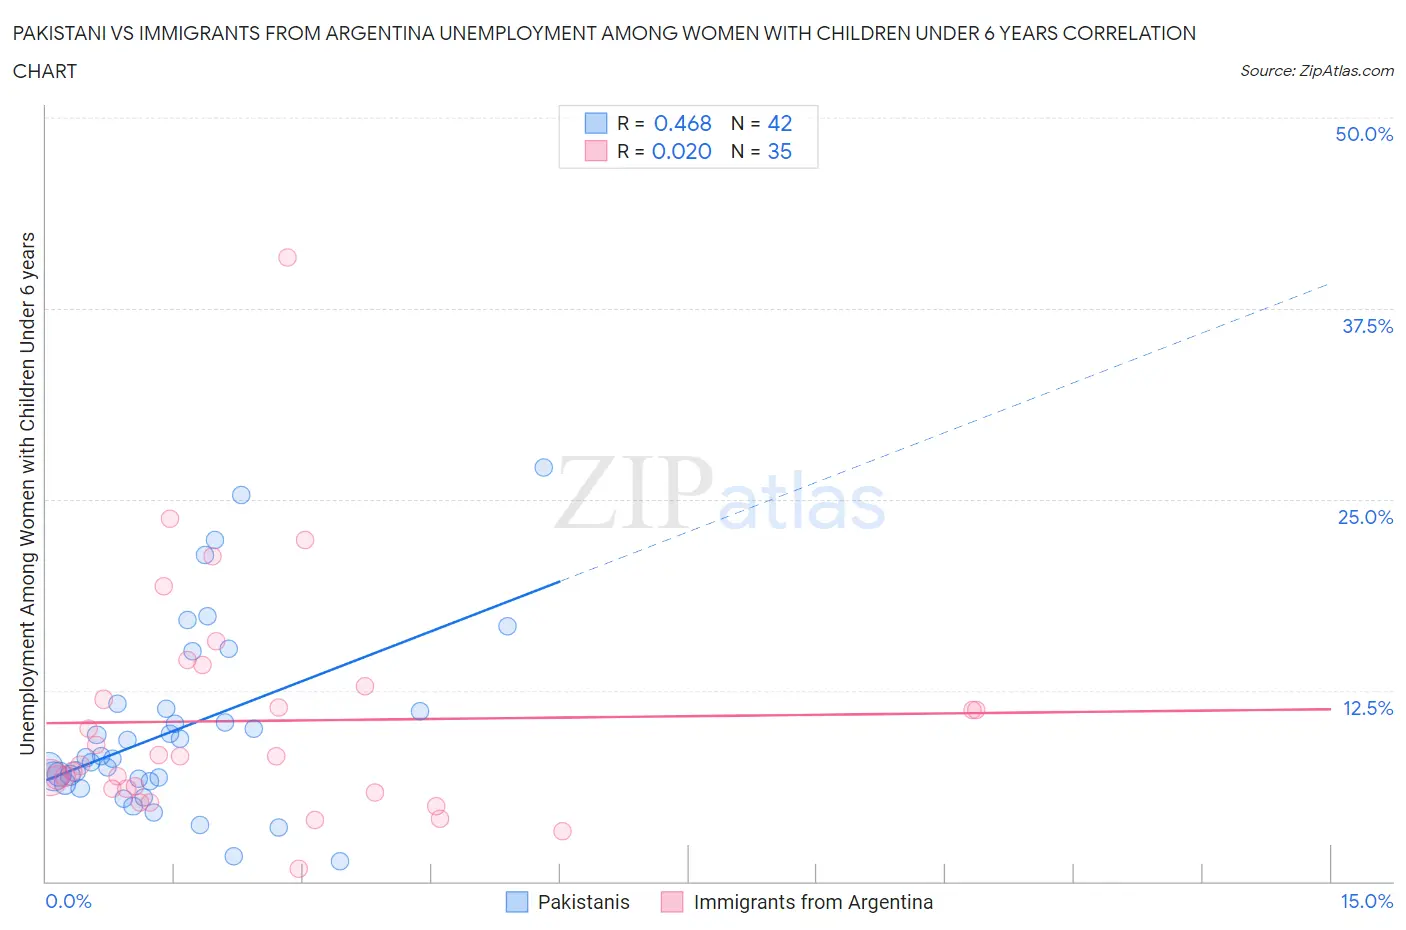
Pakistani vs Immigrants from Argentina Unemployment Among Women with Children Under 6 years Correlation Chart
The statistical analysis conducted on geographies consisting of 266,898,941 people shows a moderate positive correlation between the proportion of Pakistanis and unemployment rate among women with children under the age of 6 in the United States with a correlation coefficient (R) of 0.468 and weighted average of 7.3%. Similarly, the statistical analysis conducted on geographies consisting of 215,800,646 people shows no correlation between the proportion of Immigrants from Argentina and unemployment rate among women with children under the age of 6 in the United States with a correlation coefficient (R) of 0.020 and weighted average of 7.5%, a difference of 1.7%.
Unemployment Among Women with Children Under 6 years Correlation Summary
| Measurement | Pakistani | Immigrants from Argentina |
| Minimum | 1.3% | 0.80% |
| Maximum | 27.1% | 40.8% |
| Range | 25.8% | 40.0% |
| Mean | 10.0% | 10.5% |
| Median | 8.0% | 8.2% |
| Interquartile 25% (IQ1) | 6.5% | 6.0% |
| Interquartile 75% (IQ3) | 11.3% | 12.8% |
| Interquartile Range (IQR) | 4.8% | 6.7% |
| Standard Deviation (Sample) | 6.0% | 7.6% |
| Standard Deviation (Population) | 5.9% | 7.5% |
Demographics Similar to Pakistanis and Immigrants from Argentina by Unemployment Among Women with Children Under 6 years
In terms of unemployment among women with children under 6 years, the demographic groups most similar to Pakistanis are Immigrants from Burma/Myanmar (7.3%, a difference of 0.070%), Immigrants from South Africa (7.3%, a difference of 0.080%), Jordanian (7.3%, a difference of 0.16%), Zimbabwean (7.3%, a difference of 0.17%), and Immigrants from Zaire (7.3%, a difference of 0.28%). Similarly, the demographic groups most similar to Immigrants from Argentina are Korean (7.5%, a difference of 0.020%), Greek (7.4%, a difference of 0.12%), Scandinavian (7.4%, a difference of 0.18%), Immigrants from Colombia (7.4%, a difference of 0.29%), and Immigrants from Norway (7.4%, a difference of 0.31%).
| Demographics | Rating | Rank | Unemployment Among Women with Children Under 6 years |
| Immigrants | Zaire | 93.3 /100 | #123 | Exceptional 7.3% |
| Immigrants | South Africa | 92.5 /100 | #124 | Exceptional 7.3% |
| Pakistanis | 92.2 /100 | #125 | Exceptional 7.3% |
| Immigrants | Burma/Myanmar | 91.9 /100 | #126 | Exceptional 7.3% |
| Jordanians | 91.5 /100 | #127 | Exceptional 7.3% |
| Zimbabweans | 91.5 /100 | #128 | Exceptional 7.3% |
| Slovenes | 89.2 /100 | #129 | Excellent 7.4% |
| Swedes | 88.4 /100 | #130 | Excellent 7.4% |
| Ukrainians | 88.2 /100 | #131 | Excellent 7.4% |
| Immigrants | Armenia | 87.4 /100 | #132 | Excellent 7.4% |
| Immigrants | Uganda | 86.5 /100 | #133 | Excellent 7.4% |
| Immigrants | Bolivia | 85.7 /100 | #134 | Excellent 7.4% |
| Immigrants | Northern Africa | 85.3 /100 | #135 | Excellent 7.4% |
| Immigrants | Morocco | 84.9 /100 | #136 | Excellent 7.4% |
| Immigrants | Cambodia | 84.6 /100 | #137 | Excellent 7.4% |
| Immigrants | Norway | 84.1 /100 | #138 | Excellent 7.4% |
| Immigrants | Colombia | 83.9 /100 | #139 | Excellent 7.4% |
| Scandinavians | 83.0 /100 | #140 | Excellent 7.4% |
| Greeks | 82.6 /100 | #141 | Excellent 7.4% |
| Immigrants | Argentina | 81.5 /100 | #142 | Excellent 7.5% |
| Koreans | 81.3 /100 | #143 | Excellent 7.5% |