Menominee vs Sri Lankan Unemployment Among Women with Children Under 6 years
COMPARE
Menominee
Sri Lankan
Unemployment Among Women with Children Under 6 years
Unemployment Among Women with Children Under 6 years Comparison
Menominee
Sri Lankans
8.7%
UNEMPLOYMENT AMONG WOMEN WITH CHILDREN UNDER 6 YEARS
0.0/ 100
METRIC RATING
287th/ 347
METRIC RANK
6.6%
UNEMPLOYMENT AMONG WOMEN WITH CHILDREN UNDER 6 YEARS
100.0/ 100
METRIC RATING
37th/ 347
METRIC RANK
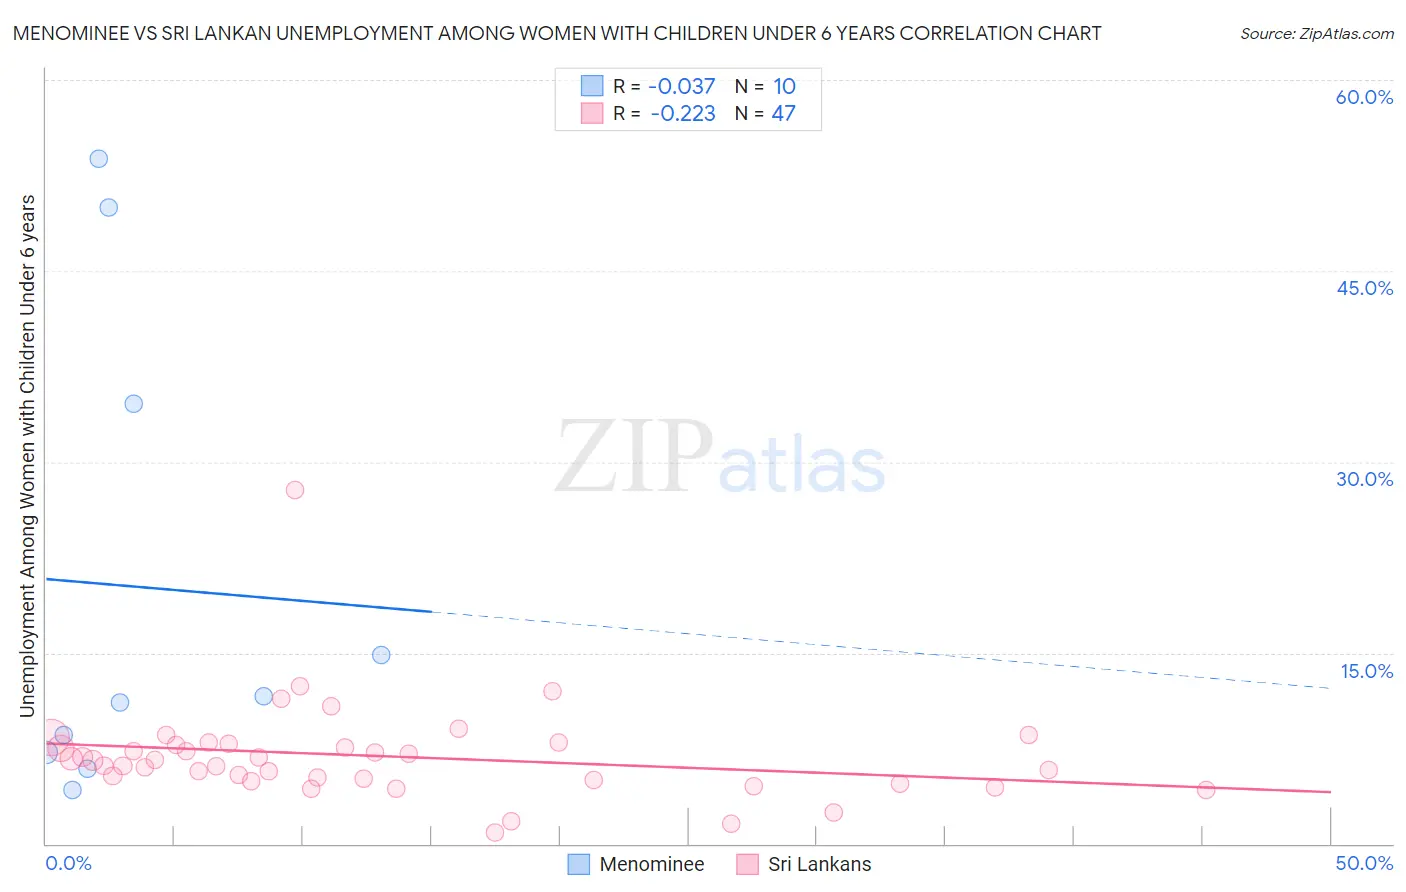
Menominee vs Sri Lankan Unemployment Among Women with Children Under 6 years Correlation Chart
The statistical analysis conducted on geographies consisting of 41,178,371 people shows no correlation between the proportion of Menominee and unemployment rate among women with children under the age of 6 in the United States with a correlation coefficient (R) of -0.037 and weighted average of 8.7%. Similarly, the statistical analysis conducted on geographies consisting of 330,167,868 people shows a weak negative correlation between the proportion of Sri Lankans and unemployment rate among women with children under the age of 6 in the United States with a correlation coefficient (R) of -0.223 and weighted average of 6.6%, a difference of 31.1%.
Unemployment Among Women with Children Under 6 years Correlation Summary
| Measurement | Menominee | Sri Lankan |
| Minimum | 4.2% | 0.90% |
| Maximum | 53.8% | 27.8% |
| Range | 49.6% | 26.9% |
| Mean | 20.2% | 6.9% |
| Median | 11.3% | 6.5% |
| Interquartile 25% (IQ1) | 7.2% | 5.0% |
| Interquartile 75% (IQ3) | 34.6% | 7.9% |
| Interquartile Range (IQR) | 27.4% | 2.9% |
| Standard Deviation (Sample) | 18.8% | 3.9% |
| Standard Deviation (Population) | 17.8% | 3.9% |
Similar Demographics by Unemployment Among Women with Children Under 6 years
Demographics Similar to Menominee by Unemployment Among Women with Children Under 6 years
In terms of unemployment among women with children under 6 years, the demographic groups most similar to Menominee are U.S. Virgin Islander (8.7%, a difference of 0.15%), Seminole (8.7%, a difference of 0.15%), Bahamian (8.7%, a difference of 0.20%), Iroquois (8.7%, a difference of 0.31%), and Blackfeet (8.7%, a difference of 0.35%).
| Demographics | Rating | Rank | Unemployment Among Women with Children Under 6 years |
| Immigrants | Belize | 0.0 /100 | #280 | Tragic 8.6% |
| Guatemalans | 0.0 /100 | #281 | Tragic 8.7% |
| Bermudans | 0.0 /100 | #282 | Tragic 8.7% |
| Spanish American Indians | 0.0 /100 | #283 | Tragic 8.7% |
| Blackfeet | 0.0 /100 | #284 | Tragic 8.7% |
| U.S. Virgin Islanders | 0.0 /100 | #285 | Tragic 8.7% |
| Seminole | 0.0 /100 | #286 | Tragic 8.7% |
| Menominee | 0.0 /100 | #287 | Tragic 8.7% |
| Bahamians | 0.0 /100 | #288 | Tragic 8.7% |
| Iroquois | 0.0 /100 | #289 | Tragic 8.7% |
| Vietnamese | 0.0 /100 | #290 | Tragic 8.8% |
| Jamaicans | 0.0 /100 | #291 | Tragic 8.8% |
| Cheyenne | 0.0 /100 | #292 | Tragic 8.8% |
| Immigrants | Bangladesh | 0.0 /100 | #293 | Tragic 8.8% |
| Immigrants | Nonimmigrants | 0.0 /100 | #294 | Tragic 8.8% |
Demographics Similar to Sri Lankans by Unemployment Among Women with Children Under 6 years
In terms of unemployment among women with children under 6 years, the demographic groups most similar to Sri Lankans are Hmong (6.7%, a difference of 0.13%), Immigrants from Russia (6.7%, a difference of 0.19%), Luxembourger (6.6%, a difference of 0.25%), Yakama (6.6%, a difference of 0.32%), and Asian (6.7%, a difference of 0.41%).
| Demographics | Rating | Rank | Unemployment Among Women with Children Under 6 years |
| Immigrants | Belarus | 100.0 /100 | #30 | Exceptional 6.6% |
| Immigrants | Moldova | 100.0 /100 | #31 | Exceptional 6.6% |
| Tsimshian | 100.0 /100 | #32 | Exceptional 6.6% |
| Immigrants | Vietnam | 100.0 /100 | #33 | Exceptional 6.6% |
| Immigrants | South Central Asia | 100.0 /100 | #34 | Exceptional 6.6% |
| Yakama | 100.0 /100 | #35 | Exceptional 6.6% |
| Luxembourgers | 100.0 /100 | #36 | Exceptional 6.6% |
| Sri Lankans | 100.0 /100 | #37 | Exceptional 6.6% |
| Hmong | 100.0 /100 | #38 | Exceptional 6.7% |
| Immigrants | Russia | 100.0 /100 | #39 | Exceptional 6.7% |
| Asians | 100.0 /100 | #40 | Exceptional 6.7% |
| Immigrants | Indonesia | 99.9 /100 | #41 | Exceptional 6.7% |
| Immigrants | Cuba | 99.9 /100 | #42 | Exceptional 6.7% |
| Bhutanese | 99.9 /100 | #43 | Exceptional 6.7% |
| Iranians | 99.9 /100 | #44 | Exceptional 6.7% |