Apache vs Immigrants from Asia Female Unemployment
COMPARE
Apache
Immigrants from Asia
Female Unemployment
Female Unemployment Comparison
Apache
Immigrants from Asia
6.6%
FEMALE UNEMPLOYMENT
0.0/ 100
METRIC RATING
325th/ 347
METRIC RANK
5.2%
FEMALE UNEMPLOYMENT
64.3/ 100
METRIC RATING
163rd/ 347
METRIC RANK
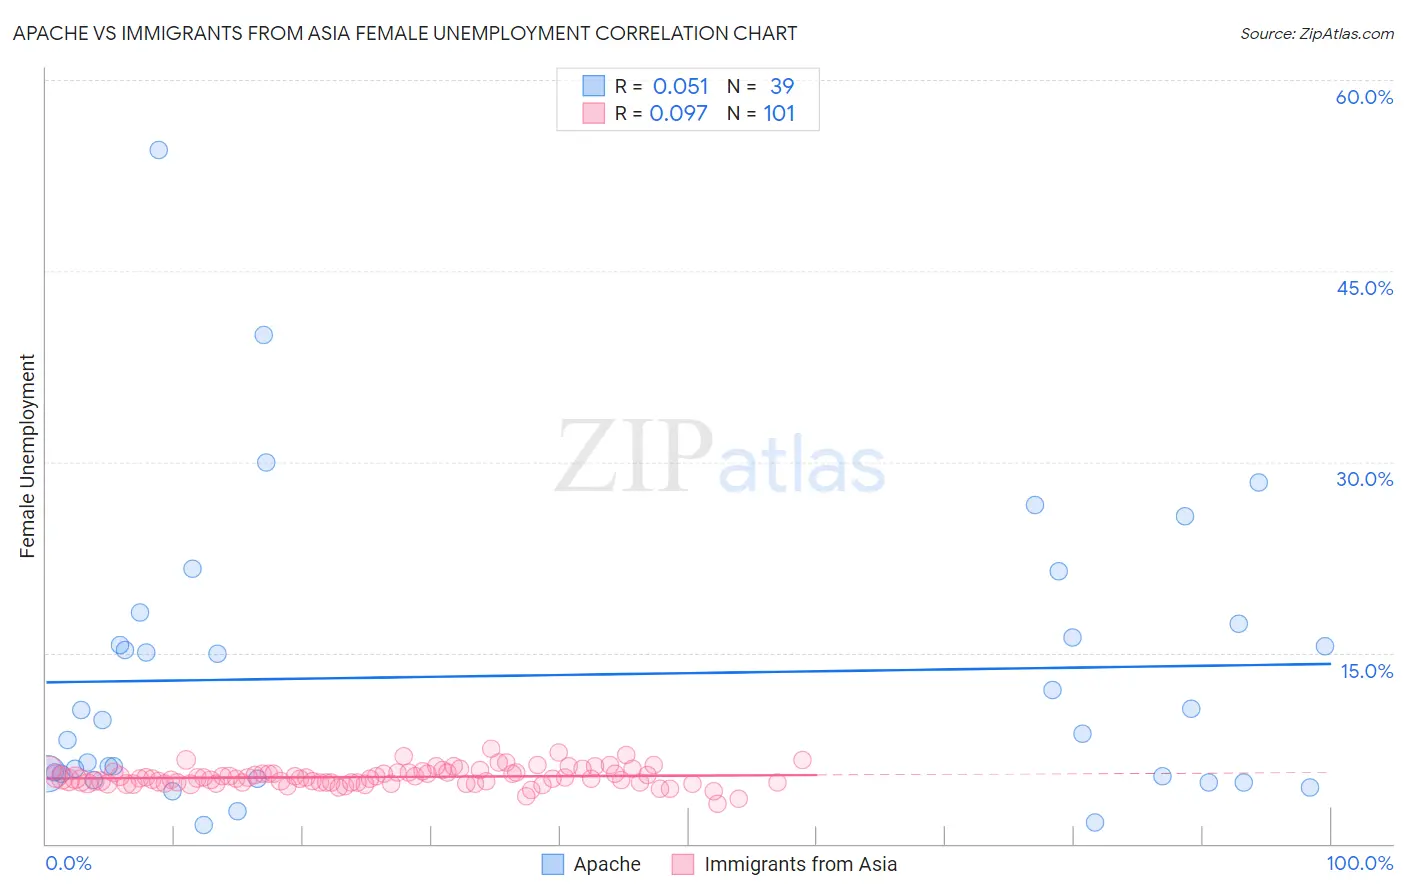
Apache vs Immigrants from Asia Female Unemployment Correlation Chart
The statistical analysis conducted on geographies consisting of 230,279,610 people shows a slight positive correlation between the proportion of Apache and unemploymnet rate among females in the United States with a correlation coefficient (R) of 0.051 and weighted average of 6.6%. Similarly, the statistical analysis conducted on geographies consisting of 540,737,875 people shows a slight positive correlation between the proportion of Immigrants from Asia and unemploymnet rate among females in the United States with a correlation coefficient (R) of 0.097 and weighted average of 5.2%, a difference of 26.5%.
Female Unemployment Correlation Summary
| Measurement | Apache | Immigrants from Asia |
| Minimum | 1.5% | 3.1% |
| Maximum | 54.5% | 7.5% |
| Range | 53.0% | 4.4% |
| Mean | 13.2% | 5.2% |
| Median | 9.7% | 5.2% |
| Interquartile 25% (IQ1) | 5.3% | 4.8% |
| Interquartile 75% (IQ3) | 17.3% | 5.6% |
| Interquartile Range (IQR) | 12.0% | 0.82% |
| Standard Deviation (Sample) | 11.3% | 0.72% |
| Standard Deviation (Population) | 11.1% | 0.72% |
Similar Demographics by Female Unemployment
Demographics Similar to Apache by Female Unemployment
In terms of female unemployment, the demographic groups most similar to Apache are Cheyenne (6.6%, a difference of 0.27%), Native/Alaskan (6.6%, a difference of 0.56%), Alaska Native (6.6%, a difference of 0.64%), Guyanese (6.7%, a difference of 1.1%), and Immigrants from Belize (6.5%, a difference of 1.3%).
| Demographics | Rating | Rank | Female Unemployment |
| British West Indians | 0.0 /100 | #318 | Tragic 6.4% |
| Immigrants | Bangladesh | 0.0 /100 | #319 | Tragic 6.5% |
| Immigrants | Dominica | 0.0 /100 | #320 | Tragic 6.5% |
| Blacks/African Americans | 0.0 /100 | #321 | Tragic 6.5% |
| Vietnamese | 0.0 /100 | #322 | Tragic 6.5% |
| Immigrants | Belize | 0.0 /100 | #323 | Tragic 6.5% |
| Cheyenne | 0.0 /100 | #324 | Tragic 6.6% |
| Apache | 0.0 /100 | #325 | Tragic 6.6% |
| Natives/Alaskans | 0.0 /100 | #326 | Tragic 6.6% |
| Alaska Natives | 0.0 /100 | #327 | Tragic 6.6% |
| Guyanese | 0.0 /100 | #328 | Tragic 6.7% |
| Immigrants | Guyana | 0.0 /100 | #329 | Tragic 6.7% |
| Yakama | 0.0 /100 | #330 | Tragic 6.7% |
| Paiute | 0.0 /100 | #331 | Tragic 6.8% |
| Sioux | 0.0 /100 | #332 | Tragic 7.0% |
Demographics Similar to Immigrants from Asia by Female Unemployment
In terms of female unemployment, the demographic groups most similar to Immigrants from Asia are Bangladeshi (5.2%, a difference of 0.0%), Syrian (5.2%, a difference of 0.10%), Native Hawaiian (5.2%, a difference of 0.10%), Potawatomi (5.2%, a difference of 0.11%), and Immigrants from Thailand (5.2%, a difference of 0.14%).
| Demographics | Rating | Rank | Female Unemployment |
| Immigrants | Northern Africa | 69.6 /100 | #156 | Good 5.2% |
| Immigrants | Russia | 69.3 /100 | #157 | Good 5.2% |
| Albanians | 68.3 /100 | #158 | Good 5.2% |
| Immigrants | Micronesia | 66.9 /100 | #159 | Good 5.2% |
| Immigrants | Spain | 66.8 /100 | #160 | Good 5.2% |
| Immigrants | Pakistan | 66.7 /100 | #161 | Good 5.2% |
| Potawatomi | 65.9 /100 | #162 | Good 5.2% |
| Immigrants | Asia | 64.3 /100 | #163 | Good 5.2% |
| Bangladeshis | 64.3 /100 | #164 | Good 5.2% |
| Syrians | 62.8 /100 | #165 | Good 5.2% |
| Native Hawaiians | 62.7 /100 | #166 | Good 5.2% |
| Immigrants | Thailand | 62.1 /100 | #167 | Good 5.2% |
| Sri Lankans | 59.4 /100 | #168 | Average 5.2% |
| Immigrants | Chile | 59.0 /100 | #169 | Average 5.2% |
| Spanish | 55.9 /100 | #170 | Average 5.2% |