Pima vs Immigrants from Asia Female Unemployment
COMPARE
Pima
Immigrants from Asia
Female Unemployment
Female Unemployment Comparison
Pima
Immigrants from Asia
9.3%
FEMALE UNEMPLOYMENT
0.0/ 100
METRIC RATING
344th/ 347
METRIC RANK
5.2%
FEMALE UNEMPLOYMENT
64.3/ 100
METRIC RATING
163rd/ 347
METRIC RANK
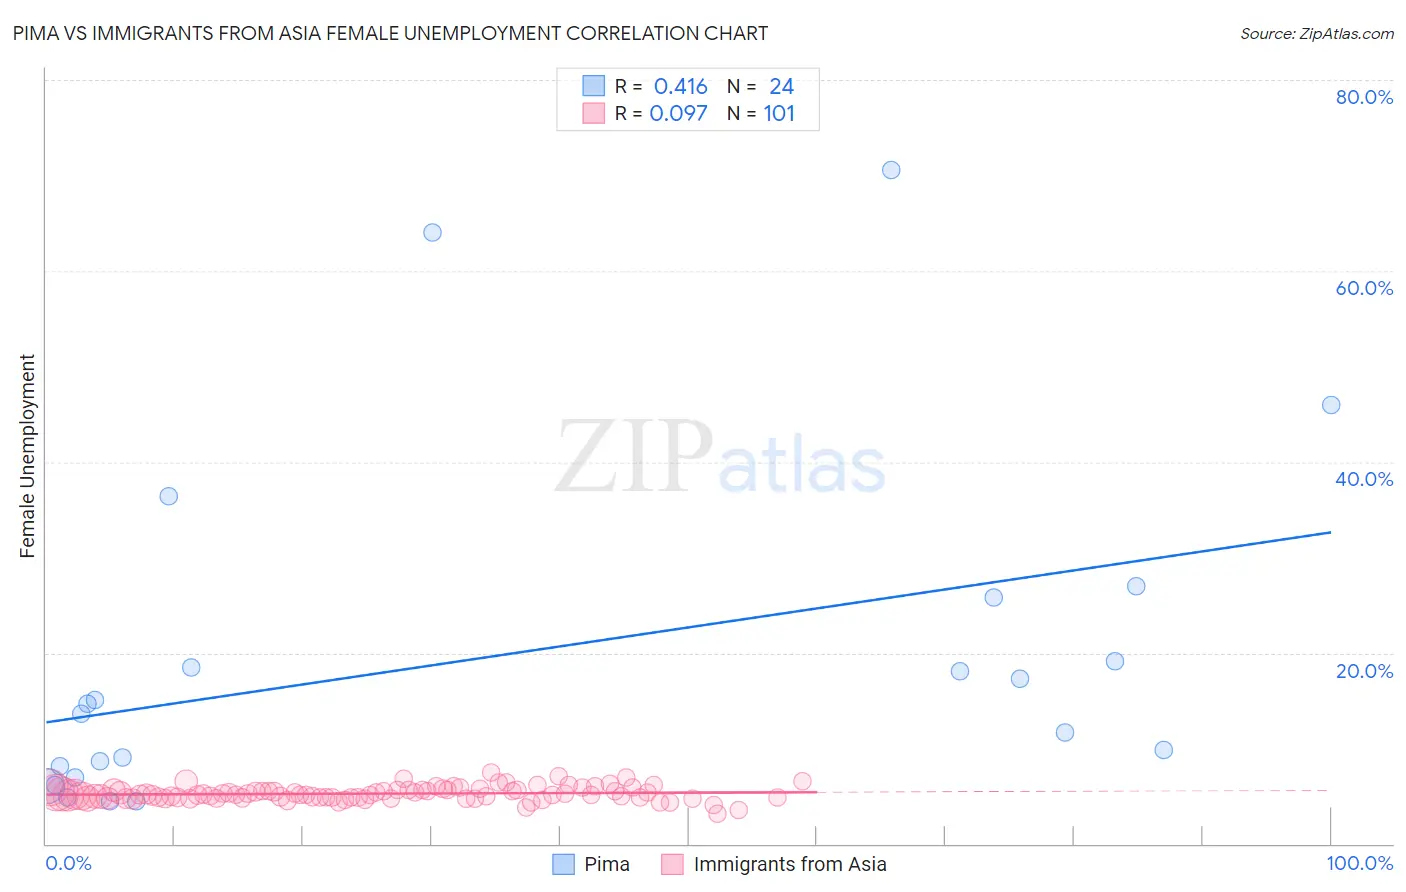
Pima vs Immigrants from Asia Female Unemployment Correlation Chart
The statistical analysis conducted on geographies consisting of 61,489,621 people shows a moderate positive correlation between the proportion of Pima and unemploymnet rate among females in the United States with a correlation coefficient (R) of 0.416 and weighted average of 9.3%. Similarly, the statistical analysis conducted on geographies consisting of 540,737,875 people shows a slight positive correlation between the proportion of Immigrants from Asia and unemploymnet rate among females in the United States with a correlation coefficient (R) of 0.097 and weighted average of 5.2%, a difference of 79.1%.
Female Unemployment Correlation Summary
| Measurement | Pima | Immigrants from Asia |
| Minimum | 4.5% | 3.1% |
| Maximum | 70.6% | 7.5% |
| Range | 66.1% | 4.4% |
| Mean | 19.4% | 5.2% |
| Median | 14.2% | 5.2% |
| Interquartile 25% (IQ1) | 7.5% | 4.8% |
| Interquartile 75% (IQ3) | 22.5% | 5.6% |
| Interquartile Range (IQR) | 14.9% | 0.82% |
| Standard Deviation (Sample) | 18.0% | 0.72% |
| Standard Deviation (Population) | 17.6% | 0.72% |
Similar Demographics by Female Unemployment
Demographics Similar to Pima by Female Unemployment
In terms of female unemployment, the demographic groups most similar to Pima are Yuman (9.6%, a difference of 2.8%), Arapaho (8.8%, a difference of 6.2%), Puerto Rican (8.3%, a difference of 11.9%), Inupiat (8.2%, a difference of 14.4%), and Hopi (8.1%, a difference of 15.3%).
| Demographics | Rating | Rank | Female Unemployment |
| Menominee | 0.0 /100 | #333 | Tragic 7.0% |
| Immigrants | Armenia | 0.0 /100 | #334 | Tragic 7.1% |
| Dominicans | 0.0 /100 | #335 | Tragic 7.2% |
| Immigrants | Dominican Republic | 0.0 /100 | #336 | Tragic 7.2% |
| Navajo | 0.0 /100 | #337 | Tragic 7.3% |
| Tohono O'odham | 0.0 /100 | #338 | Tragic 7.7% |
| Immigrants | Yemen | 0.0 /100 | #339 | Tragic 7.8% |
| Hopi | 0.0 /100 | #340 | Tragic 8.1% |
| Inupiat | 0.0 /100 | #341 | Tragic 8.2% |
| Puerto Ricans | 0.0 /100 | #342 | Tragic 8.3% |
| Arapaho | 0.0 /100 | #343 | Tragic 8.8% |
| Pima | 0.0 /100 | #344 | Tragic 9.3% |
| Yuman | 0.0 /100 | #345 | Tragic 9.6% |
| Yup'ik | 0.0 /100 | #346 | Tragic 10.9% |
| Crow | 0.0 /100 | #347 | Tragic 12.1% |
Demographics Similar to Immigrants from Asia by Female Unemployment
In terms of female unemployment, the demographic groups most similar to Immigrants from Asia are Bangladeshi (5.2%, a difference of 0.0%), Syrian (5.2%, a difference of 0.10%), Native Hawaiian (5.2%, a difference of 0.10%), Potawatomi (5.2%, a difference of 0.11%), and Immigrants from Thailand (5.2%, a difference of 0.14%).
| Demographics | Rating | Rank | Female Unemployment |
| Immigrants | Northern Africa | 69.6 /100 | #156 | Good 5.2% |
| Immigrants | Russia | 69.3 /100 | #157 | Good 5.2% |
| Albanians | 68.3 /100 | #158 | Good 5.2% |
| Immigrants | Micronesia | 66.9 /100 | #159 | Good 5.2% |
| Immigrants | Spain | 66.8 /100 | #160 | Good 5.2% |
| Immigrants | Pakistan | 66.7 /100 | #161 | Good 5.2% |
| Potawatomi | 65.9 /100 | #162 | Good 5.2% |
| Immigrants | Asia | 64.3 /100 | #163 | Good 5.2% |
| Bangladeshis | 64.3 /100 | #164 | Good 5.2% |
| Syrians | 62.8 /100 | #165 | Good 5.2% |
| Native Hawaiians | 62.7 /100 | #166 | Good 5.2% |
| Immigrants | Thailand | 62.1 /100 | #167 | Good 5.2% |
| Sri Lankans | 59.4 /100 | #168 | Average 5.2% |
| Immigrants | Chile | 59.0 /100 | #169 | Average 5.2% |
| Spanish | 55.9 /100 | #170 | Average 5.2% |