Hispanic or Latino vs Celtic Female Unemployment
COMPARE
Hispanic or Latino
Celtic
Female Unemployment
Female Unemployment Comparison
Hispanics or Latinos
Celtics
6.2%
FEMALE UNEMPLOYMENT
0.0/ 100
METRIC RATING
308th/ 347
METRIC RANK
4.9%
FEMALE UNEMPLOYMENT
98.5/ 100
METRIC RATING
64th/ 347
METRIC RANK
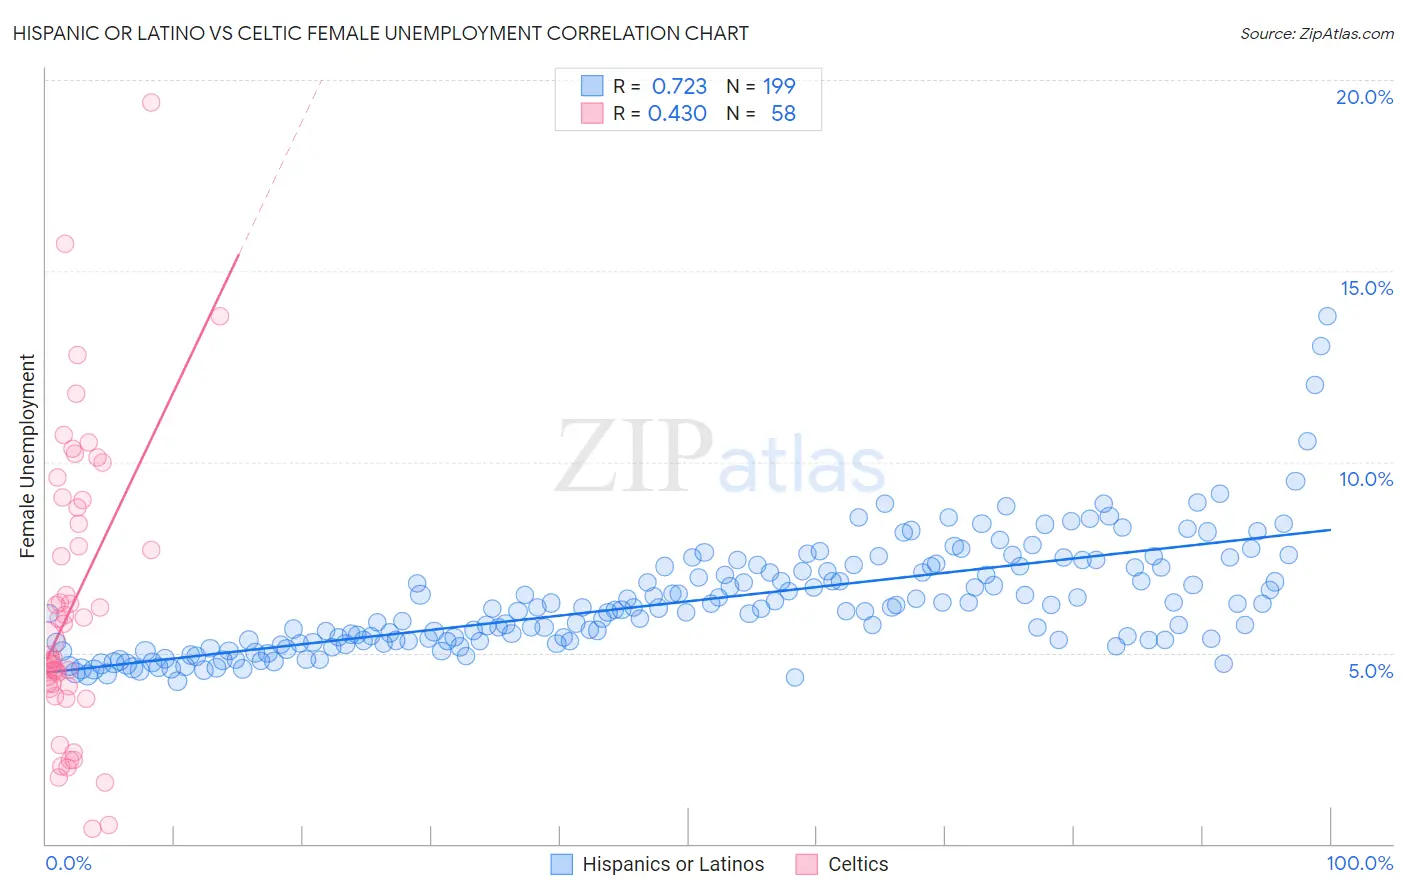
Hispanic or Latino vs Celtic Female Unemployment Correlation Chart
The statistical analysis conducted on geographies consisting of 562,804,515 people shows a strong positive correlation between the proportion of Hispanics or Latinos and unemploymnet rate among females in the United States with a correlation coefficient (R) of 0.723 and weighted average of 6.2%. Similarly, the statistical analysis conducted on geographies consisting of 168,426,082 people shows a moderate positive correlation between the proportion of Celtics and unemploymnet rate among females in the United States with a correlation coefficient (R) of 0.430 and weighted average of 4.9%, a difference of 26.5%.
Female Unemployment Correlation Summary
| Measurement | Hispanic or Latino | Celtic |
| Minimum | 4.3% | 0.40% |
| Maximum | 13.8% | 19.4% |
| Range | 9.5% | 19.0% |
| Mean | 6.3% | 6.3% |
| Median | 6.1% | 5.1% |
| Interquartile 25% (IQ1) | 5.3% | 4.1% |
| Interquartile 75% (IQ3) | 7.2% | 8.8% |
| Interquartile Range (IQR) | 1.9% | 4.7% |
| Standard Deviation (Sample) | 1.5% | 3.8% |
| Standard Deviation (Population) | 1.5% | 3.7% |
Similar Demographics by Female Unemployment
Demographics Similar to Hispanics or Latinos by Female Unemployment
In terms of female unemployment, the demographic groups most similar to Hispanics or Latinos are Shoshone (6.2%, a difference of 0.060%), Immigrants from Central America (6.2%, a difference of 0.070%), Spanish American Indian (6.2%, a difference of 0.23%), Immigrants from Jamaica (6.2%, a difference of 0.29%), and Ecuadorian (6.3%, a difference of 0.58%).
| Demographics | Rating | Rank | Female Unemployment |
| Immigrants | Barbados | 0.0 /100 | #301 | Tragic 6.2% |
| U.S. Virgin Islanders | 0.0 /100 | #302 | Tragic 6.2% |
| Barbadians | 0.0 /100 | #303 | Tragic 6.2% |
| Immigrants | Jamaica | 0.0 /100 | #304 | Tragic 6.2% |
| Spanish American Indians | 0.0 /100 | #305 | Tragic 6.2% |
| Immigrants | Central America | 0.0 /100 | #306 | Tragic 6.2% |
| Shoshone | 0.0 /100 | #307 | Tragic 6.2% |
| Hispanics or Latinos | 0.0 /100 | #308 | Tragic 6.2% |
| Ecuadorians | 0.0 /100 | #309 | Tragic 6.3% |
| Central American Indians | 0.0 /100 | #310 | Tragic 6.3% |
| Immigrants | Mexico | 0.0 /100 | #311 | Tragic 6.3% |
| Immigrants | Grenada | 0.0 /100 | #312 | Tragic 6.3% |
| Belizeans | 0.0 /100 | #313 | Tragic 6.3% |
| Immigrants | Ecuador | 0.0 /100 | #314 | Tragic 6.4% |
| Pueblo | 0.0 /100 | #315 | Tragic 6.4% |
Demographics Similar to Celtics by Female Unemployment
In terms of female unemployment, the demographic groups most similar to Celtics are Immigrants from Belgium (4.9%, a difference of 0.0%), Immigrants from Canada (4.9%, a difference of 0.12%), Immigrants from Nepal (4.9%, a difference of 0.12%), Immigrants from Scotland (4.9%, a difference of 0.13%), and Immigrants from North America (4.9%, a difference of 0.19%).
| Demographics | Rating | Rank | Female Unemployment |
| Icelanders | 98.8 /100 | #57 | Exceptional 4.9% |
| Immigrants | Lithuania | 98.8 /100 | #58 | Exceptional 4.9% |
| Bhutanese | 98.7 /100 | #59 | Exceptional 4.9% |
| Immigrants | Scotland | 98.6 /100 | #60 | Exceptional 4.9% |
| Immigrants | Canada | 98.6 /100 | #61 | Exceptional 4.9% |
| Immigrants | Nepal | 98.6 /100 | #62 | Exceptional 4.9% |
| Immigrants | Belgium | 98.5 /100 | #63 | Exceptional 4.9% |
| Celtics | 98.5 /100 | #64 | Exceptional 4.9% |
| Immigrants | North America | 98.3 /100 | #65 | Exceptional 4.9% |
| Hungarians | 98.3 /100 | #66 | Exceptional 4.9% |
| Cubans | 98.3 /100 | #67 | Exceptional 4.9% |
| Tlingit-Haida | 98.3 /100 | #68 | Exceptional 4.9% |
| Immigrants | Ireland | 98.2 /100 | #69 | Exceptional 4.9% |
| Osage | 98.2 /100 | #70 | Exceptional 4.9% |
| German Russians | 98.1 /100 | #71 | Exceptional 4.9% |