Osage vs Mexican American Indian Male Unemployment
COMPARE
Osage
Mexican American Indian
Male Unemployment
Male Unemployment Comparison
Osage
Mexican American Indians
5.3%
MALE UNEMPLOYMENT
42.5/ 100
METRIC RATING
178th/ 347
METRIC RANK
5.8%
MALE UNEMPLOYMENT
0.2/ 100
METRIC RATING
253rd/ 347
METRIC RANK
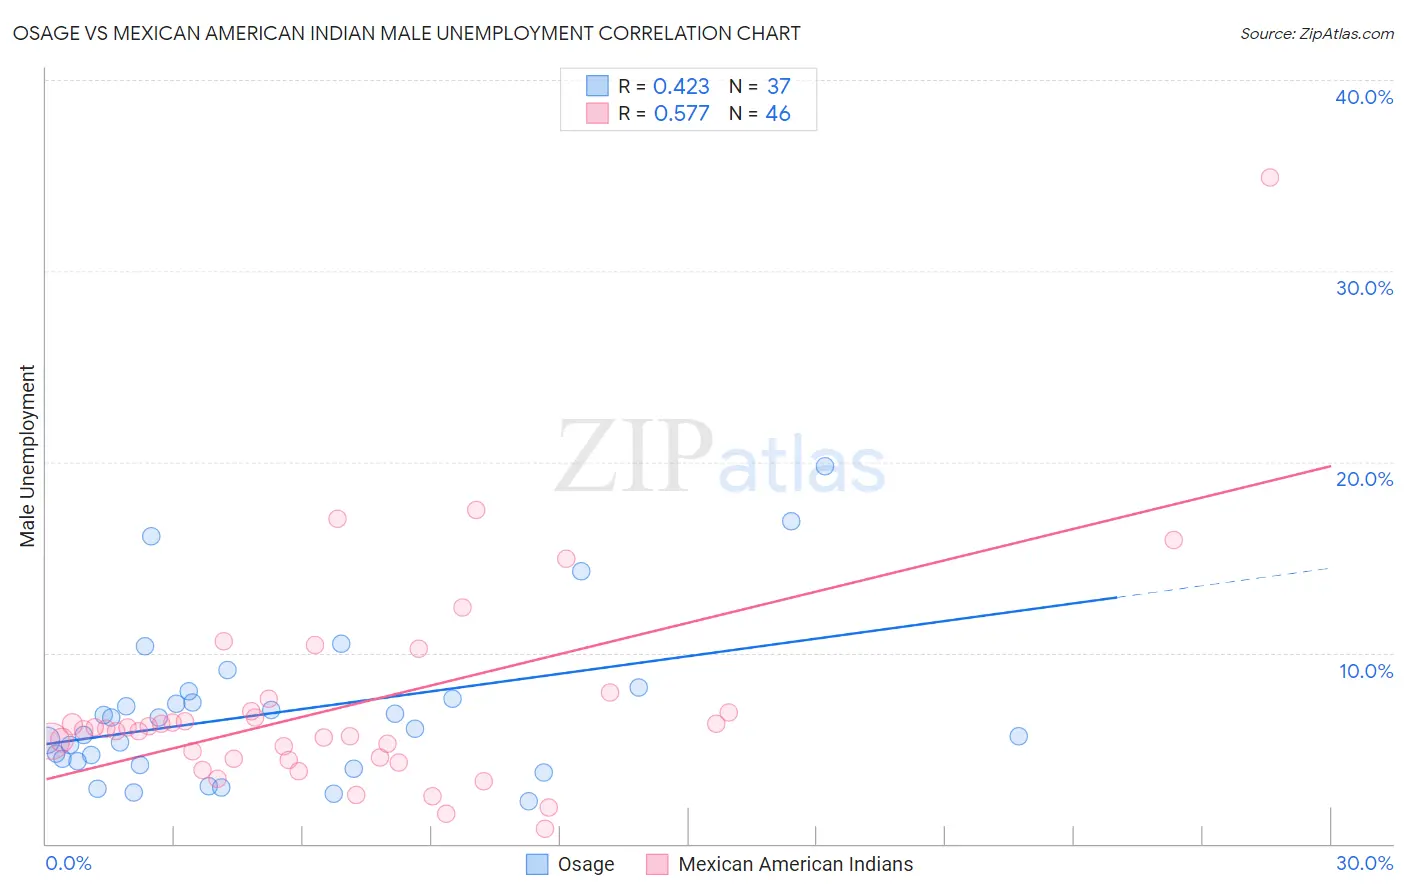
Osage vs Mexican American Indian Male Unemployment Correlation Chart
The statistical analysis conducted on geographies consisting of 91,677,196 people shows a moderate positive correlation between the proportion of Osage and unemployment rate among males in the United States with a correlation coefficient (R) of 0.423 and weighted average of 5.3%. Similarly, the statistical analysis conducted on geographies consisting of 316,861,577 people shows a substantial positive correlation between the proportion of Mexican American Indians and unemployment rate among males in the United States with a correlation coefficient (R) of 0.577 and weighted average of 5.8%, a difference of 8.5%.
Male Unemployment Correlation Summary
| Measurement | Osage | Mexican American Indian |
| Minimum | 2.2% | 0.80% |
| Maximum | 19.8% | 34.9% |
| Range | 17.6% | 34.1% |
| Mean | 6.9% | 7.2% |
| Median | 6.0% | 6.0% |
| Interquartile 25% (IQ1) | 4.2% | 4.4% |
| Interquartile 75% (IQ3) | 7.8% | 6.9% |
| Interquartile Range (IQR) | 3.6% | 2.5% |
| Standard Deviation (Sample) | 4.1% | 5.6% |
| Standard Deviation (Population) | 4.0% | 5.6% |
Similar Demographics by Male Unemployment
Demographics Similar to Osage by Male Unemployment
In terms of male unemployment, the demographic groups most similar to Osage are Immigrants from Oceania (5.3%, a difference of 0.10%), Immigrants from Peru (5.3%, a difference of 0.13%), Malaysian (5.3%, a difference of 0.17%), Immigrants from Poland (5.3%, a difference of 0.21%), and Immigrants from Afghanistan (5.3%, a difference of 0.28%).
| Demographics | Rating | Rank | Male Unemployment |
| Peruvians | 51.9 /100 | #171 | Average 5.3% |
| Immigrants | Kazakhstan | 50.8 /100 | #172 | Average 5.3% |
| Immigrants | Russia | 50.7 /100 | #173 | Average 5.3% |
| Immigrants | Iran | 50.0 /100 | #174 | Average 5.3% |
| Immigrants | Iraq | 48.1 /100 | #175 | Average 5.3% |
| Immigrants | Poland | 46.0 /100 | #176 | Average 5.3% |
| Immigrants | Peru | 44.6 /100 | #177 | Average 5.3% |
| Osage | 42.5 /100 | #178 | Average 5.3% |
| Immigrants | Oceania | 40.8 /100 | #179 | Average 5.3% |
| Malaysians | 39.6 /100 | #180 | Fair 5.3% |
| Immigrants | Afghanistan | 37.9 /100 | #181 | Fair 5.3% |
| Potawatomi | 37.8 /100 | #182 | Fair 5.3% |
| Taiwanese | 37.6 /100 | #183 | Fair 5.3% |
| Spaniards | 35.1 /100 | #184 | Fair 5.3% |
| Koreans | 34.9 /100 | #185 | Fair 5.3% |
Demographics Similar to Mexican American Indians by Male Unemployment
In terms of male unemployment, the demographic groups most similar to Mexican American Indians are Mexican (5.8%, a difference of 0.13%), Japanese (5.8%, a difference of 0.17%), Kiowa (5.8%, a difference of 0.28%), Comanche (5.8%, a difference of 0.35%), and Hispanic or Latino (5.8%, a difference of 0.52%).
| Demographics | Rating | Rank | Male Unemployment |
| Iroquois | 0.6 /100 | #246 | Tragic 5.7% |
| Hawaiians | 0.6 /100 | #247 | Tragic 5.7% |
| Marshallese | 0.5 /100 | #248 | Tragic 5.7% |
| Cree | 0.4 /100 | #249 | Tragic 5.7% |
| Immigrants | Bahamas | 0.4 /100 | #250 | Tragic 5.7% |
| Spanish Americans | 0.3 /100 | #251 | Tragic 5.7% |
| Mexicans | 0.2 /100 | #252 | Tragic 5.8% |
| Mexican American Indians | 0.2 /100 | #253 | Tragic 5.8% |
| Japanese | 0.2 /100 | #254 | Tragic 5.8% |
| Kiowa | 0.2 /100 | #255 | Tragic 5.8% |
| Comanche | 0.2 /100 | #256 | Tragic 5.8% |
| Hispanics or Latinos | 0.1 /100 | #257 | Tragic 5.8% |
| Dutch West Indians | 0.1 /100 | #258 | Tragic 5.8% |
| Cajuns | 0.1 /100 | #259 | Tragic 5.8% |
| Immigrants | Central America | 0.1 /100 | #260 | Tragic 5.8% |