Osage vs Tlingit-Haida Male Unemployment
COMPARE
Osage
Tlingit-Haida
Male Unemployment
Male Unemployment Comparison
Osage
Tlingit-Haida
5.3%
MALE UNEMPLOYMENT
42.5/ 100
METRIC RATING
178th/ 347
METRIC RANK
6.0%
MALE UNEMPLOYMENT
0.0/ 100
METRIC RATING
276th/ 347
METRIC RANK
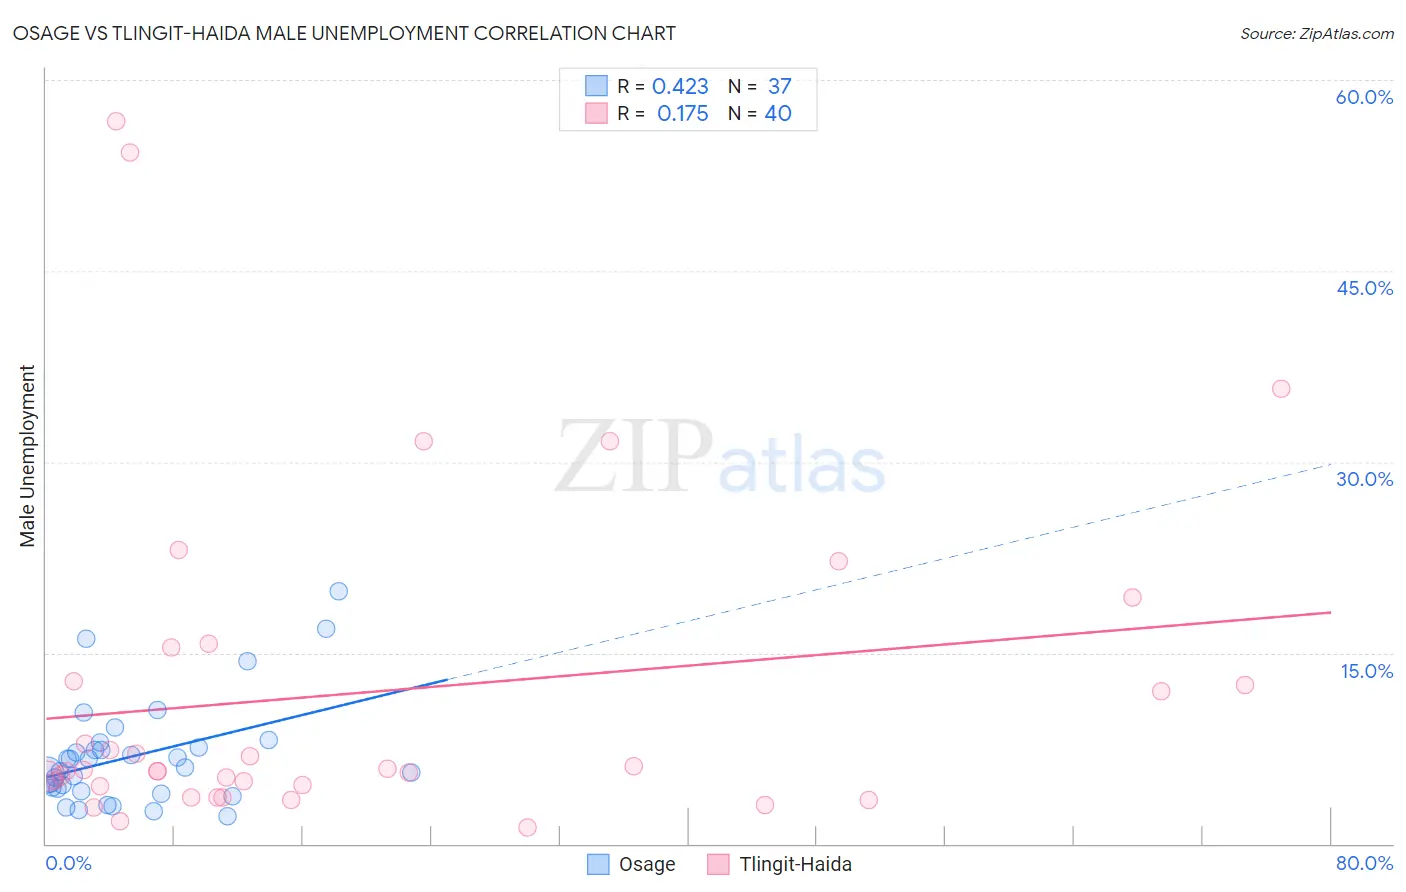
Osage vs Tlingit-Haida Male Unemployment Correlation Chart
The statistical analysis conducted on geographies consisting of 91,677,196 people shows a moderate positive correlation between the proportion of Osage and unemployment rate among males in the United States with a correlation coefficient (R) of 0.423 and weighted average of 5.3%. Similarly, the statistical analysis conducted on geographies consisting of 60,678,234 people shows a poor positive correlation between the proportion of Tlingit-Haida and unemployment rate among males in the United States with a correlation coefficient (R) of 0.175 and weighted average of 6.0%, a difference of 13.4%.
Male Unemployment Correlation Summary
| Measurement | Osage | Tlingit-Haida |
| Minimum | 2.2% | 1.3% |
| Maximum | 19.8% | 56.8% |
| Range | 17.6% | 55.5% |
| Mean | 6.9% | 11.9% |
| Median | 6.0% | 5.8% |
| Interquartile 25% (IQ1) | 4.2% | 4.6% |
| Interquartile 75% (IQ3) | 7.8% | 14.1% |
| Interquartile Range (IQR) | 3.6% | 9.5% |
| Standard Deviation (Sample) | 4.1% | 13.3% |
| Standard Deviation (Population) | 4.0% | 13.1% |
Similar Demographics by Male Unemployment
Demographics Similar to Osage by Male Unemployment
In terms of male unemployment, the demographic groups most similar to Osage are Immigrants from Oceania (5.3%, a difference of 0.10%), Immigrants from Peru (5.3%, a difference of 0.13%), Malaysian (5.3%, a difference of 0.17%), Immigrants from Poland (5.3%, a difference of 0.21%), and Immigrants from Afghanistan (5.3%, a difference of 0.28%).
| Demographics | Rating | Rank | Male Unemployment |
| Peruvians | 51.9 /100 | #171 | Average 5.3% |
| Immigrants | Kazakhstan | 50.8 /100 | #172 | Average 5.3% |
| Immigrants | Russia | 50.7 /100 | #173 | Average 5.3% |
| Immigrants | Iran | 50.0 /100 | #174 | Average 5.3% |
| Immigrants | Iraq | 48.1 /100 | #175 | Average 5.3% |
| Immigrants | Poland | 46.0 /100 | #176 | Average 5.3% |
| Immigrants | Peru | 44.6 /100 | #177 | Average 5.3% |
| Osage | 42.5 /100 | #178 | Average 5.3% |
| Immigrants | Oceania | 40.8 /100 | #179 | Average 5.3% |
| Malaysians | 39.6 /100 | #180 | Fair 5.3% |
| Immigrants | Afghanistan | 37.9 /100 | #181 | Fair 5.3% |
| Potawatomi | 37.8 /100 | #182 | Fair 5.3% |
| Taiwanese | 37.6 /100 | #183 | Fair 5.3% |
| Spaniards | 35.1 /100 | #184 | Fair 5.3% |
| Koreans | 34.9 /100 | #185 | Fair 5.3% |
Demographics Similar to Tlingit-Haida by Male Unemployment
In terms of male unemployment, the demographic groups most similar to Tlingit-Haida are Menominee (6.0%, a difference of 0.10%), Immigrants from Sierra Leone (6.0%, a difference of 0.25%), Immigrants from Liberia (6.1%, a difference of 0.42%), Immigrants from Uzbekistan (6.0%, a difference of 0.43%), and Armenian (6.0%, a difference of 0.43%).
| Demographics | Rating | Rank | Male Unemployment |
| Immigrants | Nigeria | 0.0 /100 | #269 | Tragic 6.0% |
| Sub-Saharan Africans | 0.0 /100 | #270 | Tragic 6.0% |
| Blackfeet | 0.0 /100 | #271 | Tragic 6.0% |
| Immigrants | Uzbekistan | 0.0 /100 | #272 | Tragic 6.0% |
| Armenians | 0.0 /100 | #273 | Tragic 6.0% |
| Immigrants | Sierra Leone | 0.0 /100 | #274 | Tragic 6.0% |
| Menominee | 0.0 /100 | #275 | Tragic 6.0% |
| Tlingit-Haida | 0.0 /100 | #276 | Tragic 6.0% |
| Immigrants | Liberia | 0.0 /100 | #277 | Tragic 6.1% |
| Immigrants | Fiji | 0.0 /100 | #278 | Tragic 6.1% |
| Ghanaians | 0.0 /100 | #279 | Tragic 6.1% |
| Immigrants | Ghana | 0.0 /100 | #280 | Tragic 6.2% |
| Sierra Leoneans | 0.0 /100 | #281 | Tragic 6.2% |
| Ecuadorians | 0.0 /100 | #282 | Tragic 6.2% |
| Immigrants | Western Africa | 0.0 /100 | #283 | Tragic 6.2% |