Osage vs Immigrants from Belarus Male Unemployment
COMPARE
Osage
Immigrants from Belarus
Male Unemployment
Male Unemployment Comparison
Osage
Immigrants from Belarus
5.3%
MALE UNEMPLOYMENT
42.5/ 100
METRIC RATING
178th/ 347
METRIC RANK
5.4%
MALE UNEMPLOYMENT
26.0/ 100
METRIC RATING
192nd/ 347
METRIC RANK
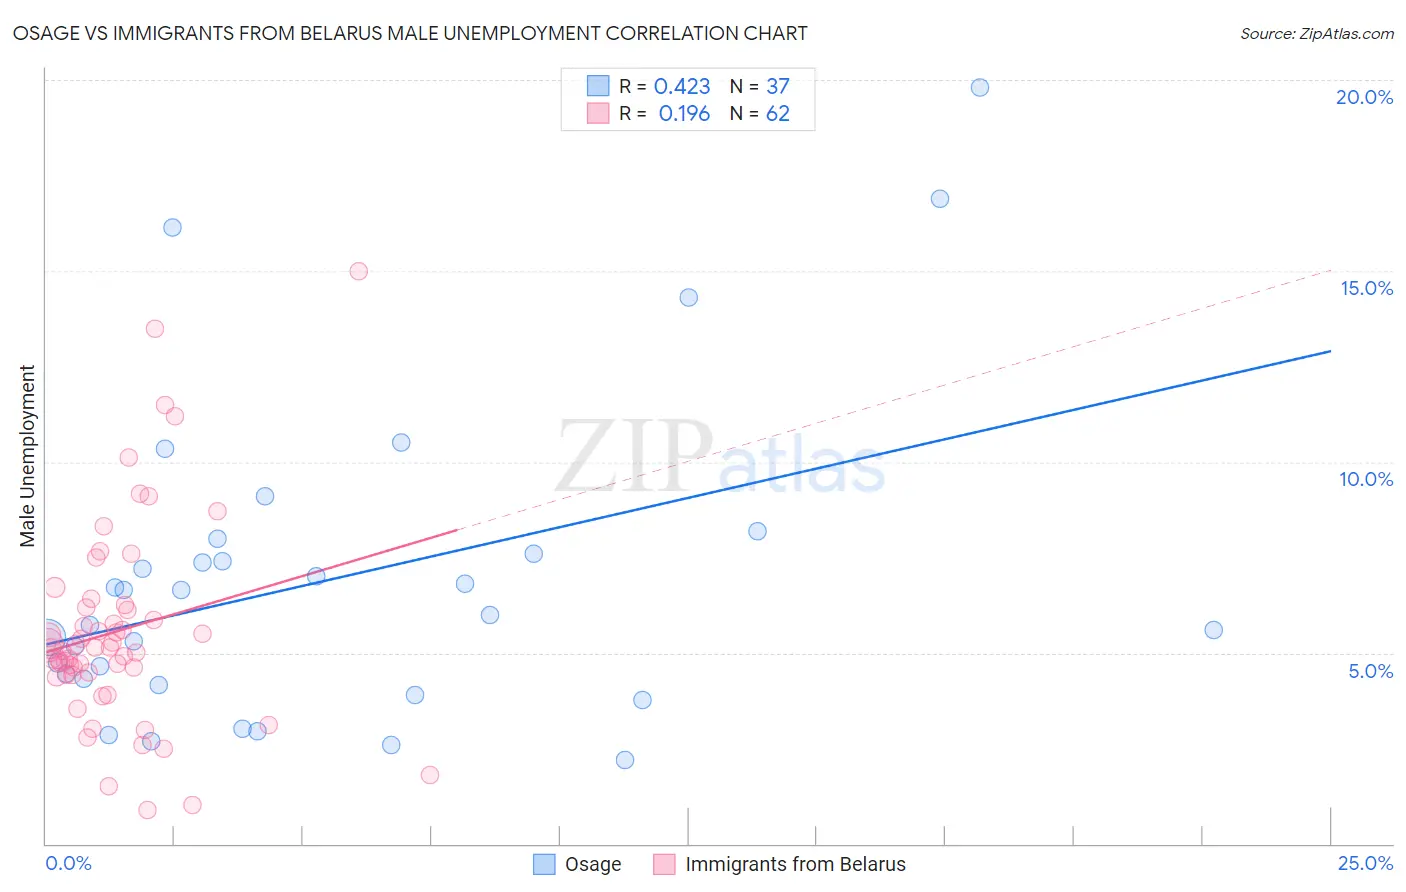
Osage vs Immigrants from Belarus Male Unemployment Correlation Chart
The statistical analysis conducted on geographies consisting of 91,677,196 people shows a moderate positive correlation between the proportion of Osage and unemployment rate among males in the United States with a correlation coefficient (R) of 0.423 and weighted average of 5.3%. Similarly, the statistical analysis conducted on geographies consisting of 150,060,028 people shows a poor positive correlation between the proportion of Immigrants from Belarus and unemployment rate among males in the United States with a correlation coefficient (R) of 0.196 and weighted average of 5.4%, a difference of 1.1%.
Male Unemployment Correlation Summary
| Measurement | Osage | Immigrants from Belarus |
| Minimum | 2.2% | 0.90% |
| Maximum | 19.8% | 15.0% |
| Range | 17.6% | 14.1% |
| Mean | 6.9% | 5.6% |
| Median | 6.0% | 5.1% |
| Interquartile 25% (IQ1) | 4.2% | 4.4% |
| Interquartile 75% (IQ3) | 7.8% | 6.2% |
| Interquartile Range (IQR) | 3.6% | 1.8% |
| Standard Deviation (Sample) | 4.1% | 2.7% |
| Standard Deviation (Population) | 4.0% | 2.7% |
Demographics Similar to Osage and Immigrants from Belarus by Male Unemployment
In terms of male unemployment, the demographic groups most similar to Osage are Immigrants from Oceania (5.3%, a difference of 0.10%), Immigrants from Peru (5.3%, a difference of 0.13%), Malaysian (5.3%, a difference of 0.17%), Immigrants from Poland (5.3%, a difference of 0.21%), and Immigrants from Afghanistan (5.3%, a difference of 0.28%). Similarly, the demographic groups most similar to Immigrants from Belarus are Immigrants from Israel (5.4%, a difference of 0.060%), Immigrants from South Eastern Asia (5.4%, a difference of 0.16%), Immigrants from Uganda (5.4%, a difference of 0.20%), Immigrants from South America (5.4%, a difference of 0.24%), and Arab (5.4%, a difference of 0.30%).
| Demographics | Rating | Rank | Male Unemployment |
| Immigrants | Iraq | 48.1 /100 | #175 | Average 5.3% |
| Immigrants | Poland | 46.0 /100 | #176 | Average 5.3% |
| Immigrants | Peru | 44.6 /100 | #177 | Average 5.3% |
| Osage | 42.5 /100 | #178 | Average 5.3% |
| Immigrants | Oceania | 40.8 /100 | #179 | Average 5.3% |
| Malaysians | 39.6 /100 | #180 | Fair 5.3% |
| Immigrants | Afghanistan | 37.9 /100 | #181 | Fair 5.3% |
| Potawatomi | 37.8 /100 | #182 | Fair 5.3% |
| Taiwanese | 37.6 /100 | #183 | Fair 5.3% |
| Spaniards | 35.1 /100 | #184 | Fair 5.3% |
| Koreans | 34.9 /100 | #185 | Fair 5.3% |
| Iraqis | 31.6 /100 | #186 | Fair 5.4% |
| Costa Ricans | 31.3 /100 | #187 | Fair 5.4% |
| Arabs | 30.2 /100 | #188 | Fair 5.4% |
| Immigrants | South America | 29.4 /100 | #189 | Fair 5.4% |
| Immigrants | Uganda | 28.8 /100 | #190 | Fair 5.4% |
| Immigrants | South Eastern Asia | 28.2 /100 | #191 | Fair 5.4% |
| Immigrants | Belarus | 26.0 /100 | #192 | Fair 5.4% |
| Immigrants | Israel | 25.2 /100 | #193 | Fair 5.4% |
| Spanish | 19.7 /100 | #194 | Poor 5.4% |
| Immigrants | Southern Europe | 17.7 /100 | #195 | Poor 5.4% |