Nicaraguan vs Haitian Unemployment Among Women with Children Ages 6 to 17 years
COMPARE
Nicaraguan
Haitian
Unemployment Among Women with Children Ages 6 to 17 years
Unemployment Among Women with Children Ages 6 to 17 years Comparison
Nicaraguans
Haitians
9.4%
UNEMPLOYMENT AMONG WOMEN WITH CHILDREN AGES 6 TO 17 YEARS
1.0/ 100
METRIC RATING
254th/ 347
METRIC RANK
10.0%
UNEMPLOYMENT AMONG WOMEN WITH CHILDREN AGES 6 TO 17 YEARS
0.0/ 100
METRIC RATING
293rd/ 347
METRIC RANK
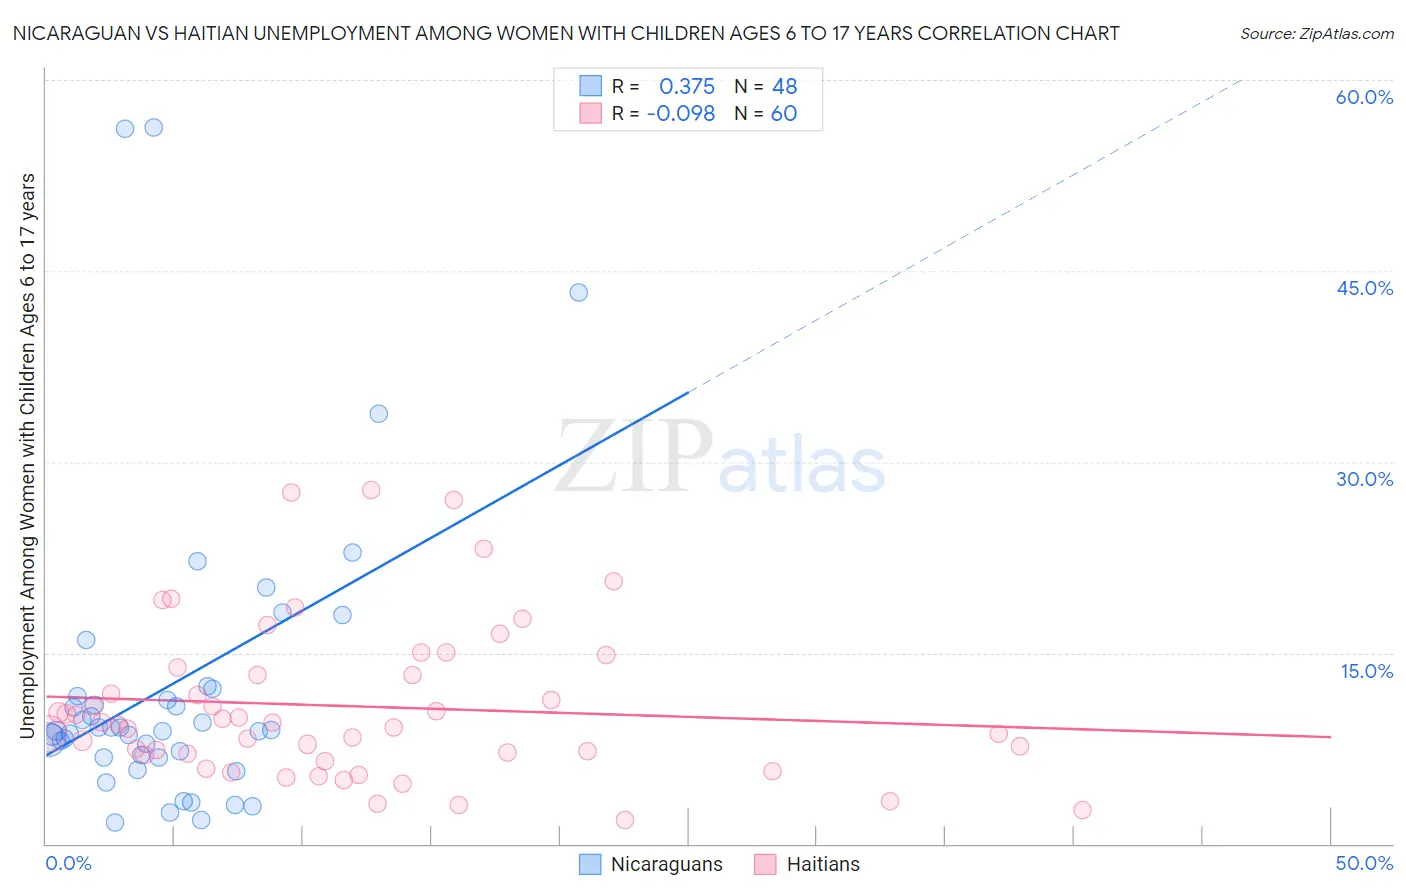
Nicaraguan vs Haitian Unemployment Among Women with Children Ages 6 to 17 years Correlation Chart
The statistical analysis conducted on geographies consisting of 225,411,193 people shows a mild positive correlation between the proportion of Nicaraguans and unemployment rate among women with children between the ages 6 and 17 in the United States with a correlation coefficient (R) of 0.375 and weighted average of 9.4%. Similarly, the statistical analysis conducted on geographies consisting of 222,141,030 people shows a slight negative correlation between the proportion of Haitians and unemployment rate among women with children between the ages 6 and 17 in the United States with a correlation coefficient (R) of -0.098 and weighted average of 10.0%, a difference of 6.2%.
Unemployment Among Women with Children Ages 6 to 17 years Correlation Summary
| Measurement | Nicaraguan | Haitian |
| Minimum | 1.6% | 1.9% |
| Maximum | 56.3% | 27.8% |
| Range | 54.7% | 25.9% |
| Mean | 12.5% | 10.8% |
| Median | 8.9% | 9.4% |
| Interquartile 25% (IQ1) | 6.9% | 7.0% |
| Interquartile 75% (IQ3) | 11.9% | 13.5% |
| Interquartile Range (IQR) | 5.0% | 6.5% |
| Standard Deviation (Sample) | 12.0% | 6.1% |
| Standard Deviation (Population) | 11.9% | 6.1% |
Similar Demographics by Unemployment Among Women with Children Ages 6 to 17 years
Demographics Similar to Nicaraguans by Unemployment Among Women with Children Ages 6 to 17 years
In terms of unemployment among women with children ages 6 to 17 years, the demographic groups most similar to Nicaraguans are Lithuanian (9.4%, a difference of 0.060%), Portuguese (9.4%, a difference of 0.17%), Canadian (9.4%, a difference of 0.23%), Creek (9.4%, a difference of 0.26%), and Celtic (9.5%, a difference of 0.26%).
| Demographics | Rating | Rank | Unemployment Among Women with Children Ages 6 to 17 years |
| Poles | 1.5 /100 | #247 | Tragic 9.4% |
| Dutch | 1.5 /100 | #248 | Tragic 9.4% |
| Immigrants | South America | 1.5 /100 | #249 | Tragic 9.4% |
| Immigrants | Guatemala | 1.3 /100 | #250 | Tragic 9.4% |
| Central Americans | 1.3 /100 | #251 | Tragic 9.4% |
| Creek | 1.2 /100 | #252 | Tragic 9.4% |
| Portuguese | 1.1 /100 | #253 | Tragic 9.4% |
| Nicaraguans | 1.0 /100 | #254 | Tragic 9.4% |
| Lithuanians | 0.9 /100 | #255 | Tragic 9.4% |
| Canadians | 0.8 /100 | #256 | Tragic 9.4% |
| Celtics | 0.7 /100 | #257 | Tragic 9.5% |
| Immigrants | Mexico | 0.7 /100 | #258 | Tragic 9.5% |
| Immigrants | Central America | 0.6 /100 | #259 | Tragic 9.5% |
| Italians | 0.6 /100 | #260 | Tragic 9.5% |
| South Americans | 0.5 /100 | #261 | Tragic 9.5% |
Demographics Similar to Haitians by Unemployment Among Women with Children Ages 6 to 17 years
In terms of unemployment among women with children ages 6 to 17 years, the demographic groups most similar to Haitians are Carpatho Rusyn (10.0%, a difference of 0.090%), Ecuadorian (10.0%, a difference of 0.090%), Nonimmigrants (10.0%, a difference of 0.10%), Subsaharan African (10.0%, a difference of 0.12%), and Cherokee (10.0%, a difference of 0.13%).
| Demographics | Rating | Rank | Unemployment Among Women with Children Ages 6 to 17 years |
| Choctaw | 0.0 /100 | #286 | Tragic 9.9% |
| Sierra Leoneans | 0.0 /100 | #287 | Tragic 9.9% |
| Shoshone | 0.0 /100 | #288 | Tragic 10.0% |
| Hondurans | 0.0 /100 | #289 | Tragic 10.0% |
| Sub-Saharan Africans | 0.0 /100 | #290 | Tragic 10.0% |
| Immigrants | Nonimmigrants | 0.0 /100 | #291 | Tragic 10.0% |
| Carpatho Rusyns | 0.0 /100 | #292 | Tragic 10.0% |
| Haitians | 0.0 /100 | #293 | Tragic 10.0% |
| Ecuadorians | 0.0 /100 | #294 | Tragic 10.0% |
| Cherokee | 0.0 /100 | #295 | Tragic 10.0% |
| Immigrants | Western Africa | 0.0 /100 | #296 | Tragic 10.1% |
| Immigrants | Caribbean | 0.0 /100 | #297 | Tragic 10.1% |
| Immigrants | Haiti | 0.0 /100 | #298 | Tragic 10.1% |
| Immigrants | Honduras | 0.0 /100 | #299 | Tragic 10.1% |
| Nigerians | 0.0 /100 | #300 | Tragic 10.1% |