Nicaraguan vs Paraguayan Unemployment Among Women with Children Ages 6 to 17 years
COMPARE
Nicaraguan
Paraguayan
Unemployment Among Women with Children Ages 6 to 17 years
Unemployment Among Women with Children Ages 6 to 17 years Comparison
Nicaraguans
Paraguayans
9.4%
UNEMPLOYMENT AMONG WOMEN WITH CHILDREN AGES 6 TO 17 YEARS
1.0/ 100
METRIC RATING
254th/ 347
METRIC RANK
10.2%
UNEMPLOYMENT AMONG WOMEN WITH CHILDREN AGES 6 TO 17 YEARS
0.0/ 100
METRIC RATING
306th/ 347
METRIC RANK
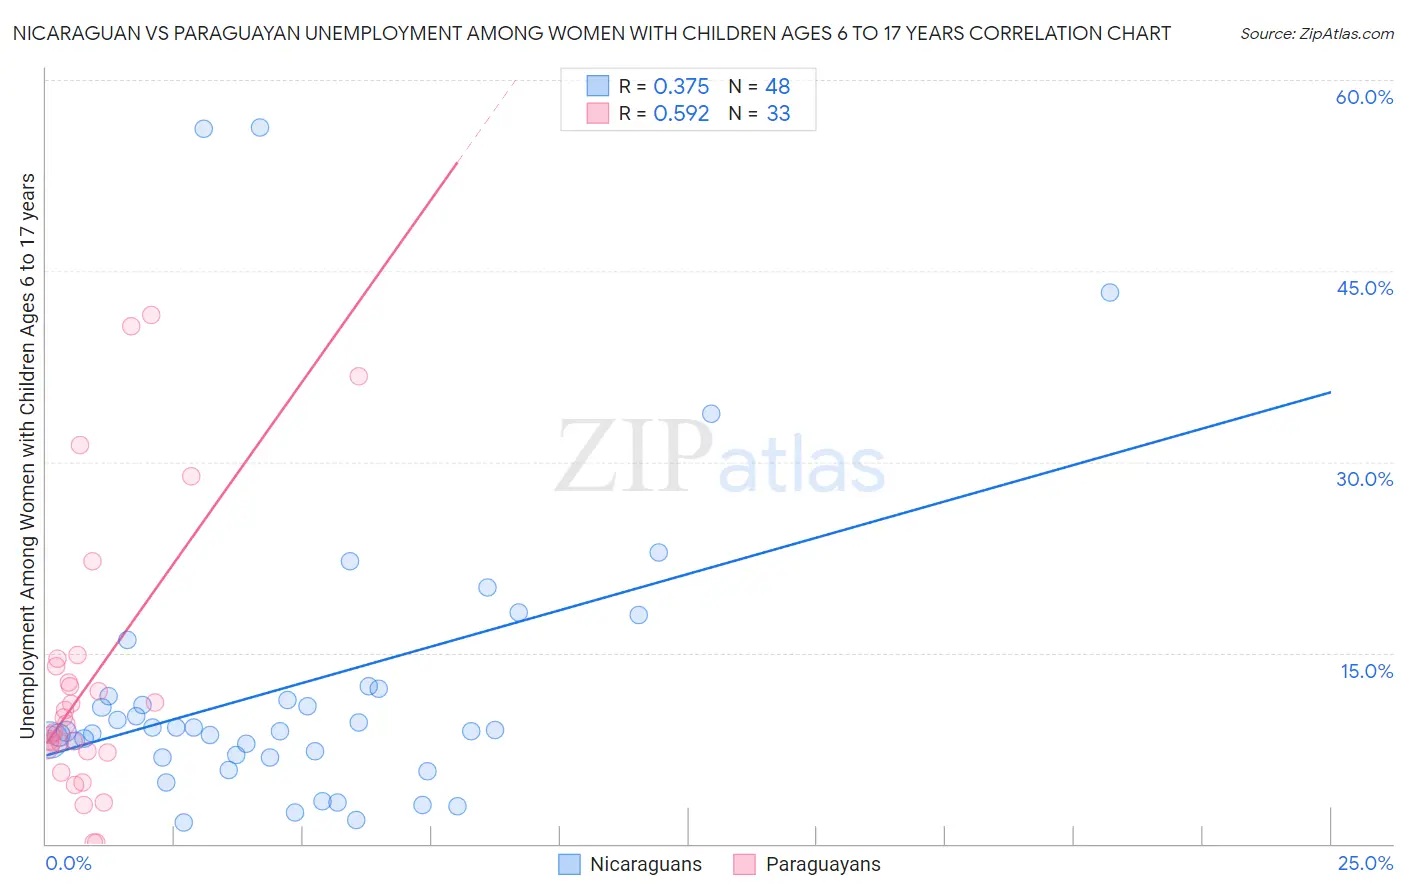
Nicaraguan vs Paraguayan Unemployment Among Women with Children Ages 6 to 17 years Correlation Chart
The statistical analysis conducted on geographies consisting of 225,411,193 people shows a mild positive correlation between the proportion of Nicaraguans and unemployment rate among women with children between the ages 6 and 17 in the United States with a correlation coefficient (R) of 0.375 and weighted average of 9.4%. Similarly, the statistical analysis conducted on geographies consisting of 81,717,447 people shows a substantial positive correlation between the proportion of Paraguayans and unemployment rate among women with children between the ages 6 and 17 in the United States with a correlation coefficient (R) of 0.592 and weighted average of 10.2%, a difference of 8.4%.
Unemployment Among Women with Children Ages 6 to 17 years Correlation Summary
| Measurement | Nicaraguan | Paraguayan |
| Minimum | 1.6% | 0.10% |
| Maximum | 56.3% | 41.5% |
| Range | 54.7% | 41.4% |
| Mean | 12.5% | 12.9% |
| Median | 8.9% | 9.4% |
| Interquartile 25% (IQ1) | 6.9% | 7.2% |
| Interquartile 75% (IQ3) | 11.9% | 14.3% |
| Interquartile Range (IQR) | 5.0% | 7.0% |
| Standard Deviation (Sample) | 12.0% | 10.9% |
| Standard Deviation (Population) | 11.9% | 10.7% |
Similar Demographics by Unemployment Among Women with Children Ages 6 to 17 years
Demographics Similar to Nicaraguans by Unemployment Among Women with Children Ages 6 to 17 years
In terms of unemployment among women with children ages 6 to 17 years, the demographic groups most similar to Nicaraguans are Lithuanian (9.4%, a difference of 0.060%), Portuguese (9.4%, a difference of 0.17%), Canadian (9.4%, a difference of 0.23%), Creek (9.4%, a difference of 0.26%), and Celtic (9.5%, a difference of 0.26%).
| Demographics | Rating | Rank | Unemployment Among Women with Children Ages 6 to 17 years |
| Poles | 1.5 /100 | #247 | Tragic 9.4% |
| Dutch | 1.5 /100 | #248 | Tragic 9.4% |
| Immigrants | South America | 1.5 /100 | #249 | Tragic 9.4% |
| Immigrants | Guatemala | 1.3 /100 | #250 | Tragic 9.4% |
| Central Americans | 1.3 /100 | #251 | Tragic 9.4% |
| Creek | 1.2 /100 | #252 | Tragic 9.4% |
| Portuguese | 1.1 /100 | #253 | Tragic 9.4% |
| Nicaraguans | 1.0 /100 | #254 | Tragic 9.4% |
| Lithuanians | 0.9 /100 | #255 | Tragic 9.4% |
| Canadians | 0.8 /100 | #256 | Tragic 9.4% |
| Celtics | 0.7 /100 | #257 | Tragic 9.5% |
| Immigrants | Mexico | 0.7 /100 | #258 | Tragic 9.5% |
| Immigrants | Central America | 0.6 /100 | #259 | Tragic 9.5% |
| Italians | 0.6 /100 | #260 | Tragic 9.5% |
| South Americans | 0.5 /100 | #261 | Tragic 9.5% |
Demographics Similar to Paraguayans by Unemployment Among Women with Children Ages 6 to 17 years
In terms of unemployment among women with children ages 6 to 17 years, the demographic groups most similar to Paraguayans are Immigrants from Senegal (10.2%, a difference of 0.23%), Dutch West Indian (10.2%, a difference of 0.24%), Immigrants from Nigeria (10.2%, a difference of 0.29%), Immigrants from Venezuela (10.2%, a difference of 0.35%), and Immigrants from Ecuador (10.2%, a difference of 0.44%).
| Demographics | Rating | Rank | Unemployment Among Women with Children Ages 6 to 17 years |
| Immigrants | Honduras | 0.0 /100 | #299 | Tragic 10.1% |
| Nigerians | 0.0 /100 | #300 | Tragic 10.1% |
| Immigrants | Bahamas | 0.0 /100 | #301 | Tragic 10.1% |
| Venezuelans | 0.0 /100 | #302 | Tragic 10.2% |
| Immigrants | Ecuador | 0.0 /100 | #303 | Tragic 10.2% |
| Immigrants | Venezuela | 0.0 /100 | #304 | Tragic 10.2% |
| Immigrants | Nigeria | 0.0 /100 | #305 | Tragic 10.2% |
| Paraguayans | 0.0 /100 | #306 | Tragic 10.2% |
| Immigrants | Senegal | 0.0 /100 | #307 | Tragic 10.2% |
| Dutch West Indians | 0.0 /100 | #308 | Tragic 10.2% |
| French Canadians | 0.0 /100 | #309 | Tragic 10.3% |
| Alaska Natives | 0.0 /100 | #310 | Tragic 10.3% |
| Immigrants | Liberia | 0.0 /100 | #311 | Tragic 10.3% |
| Africans | 0.0 /100 | #312 | Tragic 10.4% |
| Americans | 0.0 /100 | #313 | Tragic 10.4% |