Nicaraguan vs Dutch Unemployment Among Women with Children Ages 6 to 17 years
COMPARE
Nicaraguan
Dutch
Unemployment Among Women with Children Ages 6 to 17 years
Unemployment Among Women with Children Ages 6 to 17 years Comparison
Nicaraguans
Dutch
9.4%
UNEMPLOYMENT AMONG WOMEN WITH CHILDREN AGES 6 TO 17 YEARS
1.0/ 100
METRIC RATING
254th/ 347
METRIC RANK
9.4%
UNEMPLOYMENT AMONG WOMEN WITH CHILDREN AGES 6 TO 17 YEARS
1.5/ 100
METRIC RATING
248th/ 347
METRIC RANK
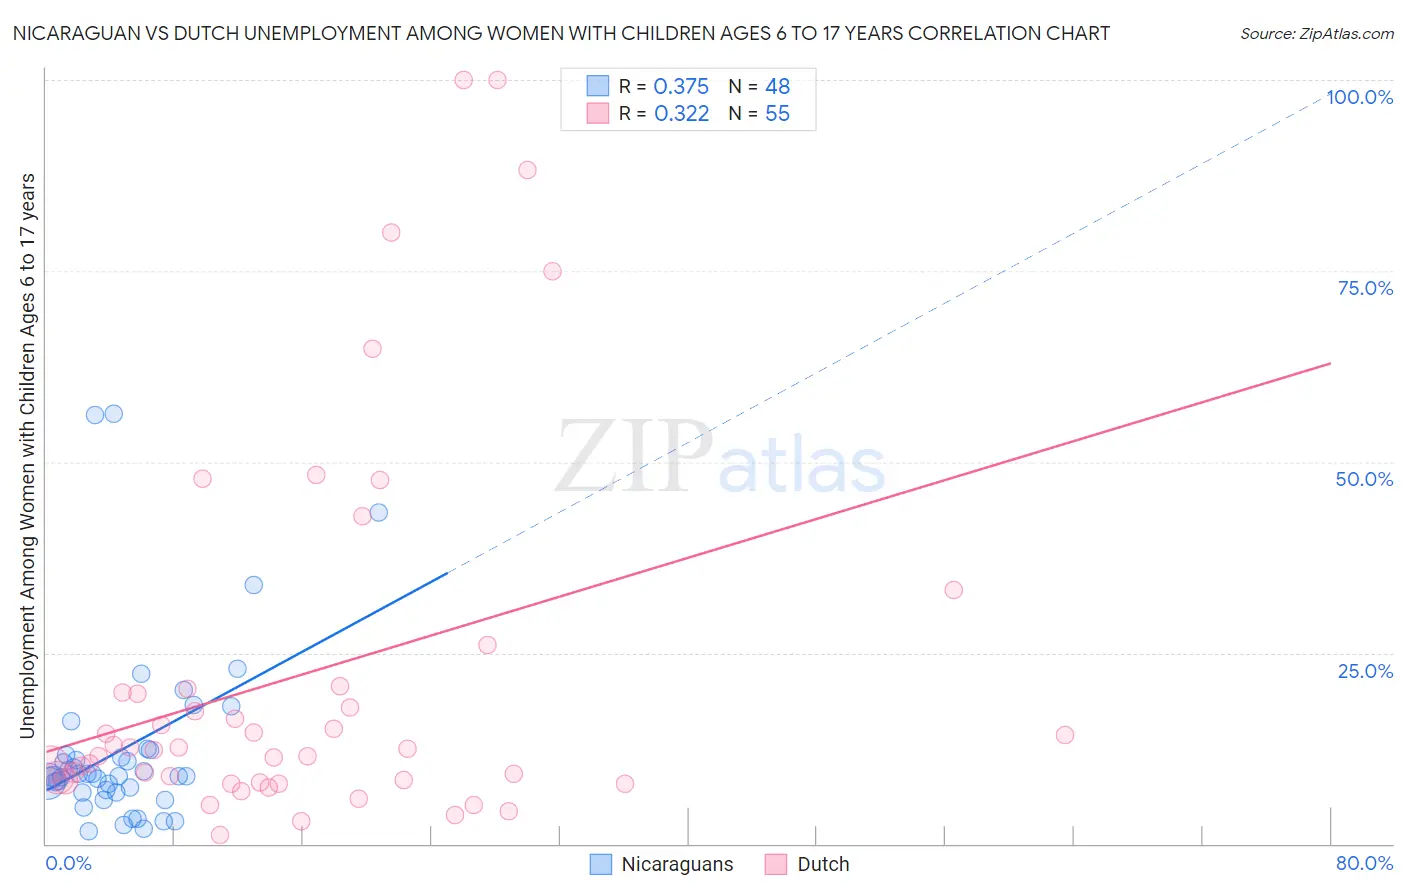
Nicaraguan vs Dutch Unemployment Among Women with Children Ages 6 to 17 years Correlation Chart
The statistical analysis conducted on geographies consisting of 225,411,193 people shows a mild positive correlation between the proportion of Nicaraguans and unemployment rate among women with children between the ages 6 and 17 in the United States with a correlation coefficient (R) of 0.375 and weighted average of 9.4%. Similarly, the statistical analysis conducted on geographies consisting of 349,724,133 people shows a mild positive correlation between the proportion of Dutch and unemployment rate among women with children between the ages 6 and 17 in the United States with a correlation coefficient (R) of 0.322 and weighted average of 9.4%, a difference of 0.47%.
Unemployment Among Women with Children Ages 6 to 17 years Correlation Summary
| Measurement | Nicaraguan | Dutch |
| Minimum | 1.6% | 1.2% |
| Maximum | 56.3% | 100.0% |
| Range | 54.7% | 98.8% |
| Mean | 12.5% | 22.3% |
| Median | 8.9% | 12.4% |
| Interquartile 25% (IQ1) | 6.9% | 8.1% |
| Interquartile 75% (IQ3) | 11.9% | 20.2% |
| Interquartile Range (IQR) | 5.0% | 12.1% |
| Standard Deviation (Sample) | 12.0% | 24.9% |
| Standard Deviation (Population) | 11.9% | 24.6% |
Demographics Similar to Nicaraguans and Dutch by Unemployment Among Women with Children Ages 6 to 17 years
In terms of unemployment among women with children ages 6 to 17 years, the demographic groups most similar to Nicaraguans are Lithuanian (9.4%, a difference of 0.060%), Portuguese (9.4%, a difference of 0.17%), Canadian (9.4%, a difference of 0.23%), Creek (9.4%, a difference of 0.26%), and Celtic (9.5%, a difference of 0.26%). Similarly, the demographic groups most similar to Dutch are Immigrants from South America (9.4%, a difference of 0.010%), Polish (9.4%, a difference of 0.040%), Immigrants from Africa (9.4%, a difference of 0.070%), Immigrants from Guatemala (9.4%, a difference of 0.10%), and Central American (9.4%, a difference of 0.11%).
| Demographics | Rating | Rank | Unemployment Among Women with Children Ages 6 to 17 years |
| Colombians | 2.2 /100 | #241 | Tragic 9.3% |
| Immigrants | Colombia | 2.1 /100 | #242 | Tragic 9.3% |
| Scottish | 2.0 /100 | #243 | Tragic 9.4% |
| English | 1.9 /100 | #244 | Tragic 9.4% |
| Immigrants | Cameroon | 1.8 /100 | #245 | Tragic 9.4% |
| Immigrants | Africa | 1.6 /100 | #246 | Tragic 9.4% |
| Poles | 1.5 /100 | #247 | Tragic 9.4% |
| Dutch | 1.5 /100 | #248 | Tragic 9.4% |
| Immigrants | South America | 1.5 /100 | #249 | Tragic 9.4% |
| Immigrants | Guatemala | 1.3 /100 | #250 | Tragic 9.4% |
| Central Americans | 1.3 /100 | #251 | Tragic 9.4% |
| Creek | 1.2 /100 | #252 | Tragic 9.4% |
| Portuguese | 1.1 /100 | #253 | Tragic 9.4% |
| Nicaraguans | 1.0 /100 | #254 | Tragic 9.4% |
| Lithuanians | 0.9 /100 | #255 | Tragic 9.4% |
| Canadians | 0.8 /100 | #256 | Tragic 9.4% |
| Celtics | 0.7 /100 | #257 | Tragic 9.5% |
| Immigrants | Mexico | 0.7 /100 | #258 | Tragic 9.5% |
| Immigrants | Central America | 0.6 /100 | #259 | Tragic 9.5% |
| Italians | 0.6 /100 | #260 | Tragic 9.5% |
| South Americans | 0.5 /100 | #261 | Tragic 9.5% |