Latvian vs Haitian Unemployment Among Women with Children Ages 6 to 17 years
COMPARE
Latvian
Haitian
Unemployment Among Women with Children Ages 6 to 17 years
Unemployment Among Women with Children Ages 6 to 17 years Comparison
Latvians
Haitians
8.6%
UNEMPLOYMENT AMONG WOMEN WITH CHILDREN AGES 6 TO 17 YEARS
97.4/ 100
METRIC RATING
110th/ 347
METRIC RANK
10.0%
UNEMPLOYMENT AMONG WOMEN WITH CHILDREN AGES 6 TO 17 YEARS
0.0/ 100
METRIC RATING
293rd/ 347
METRIC RANK
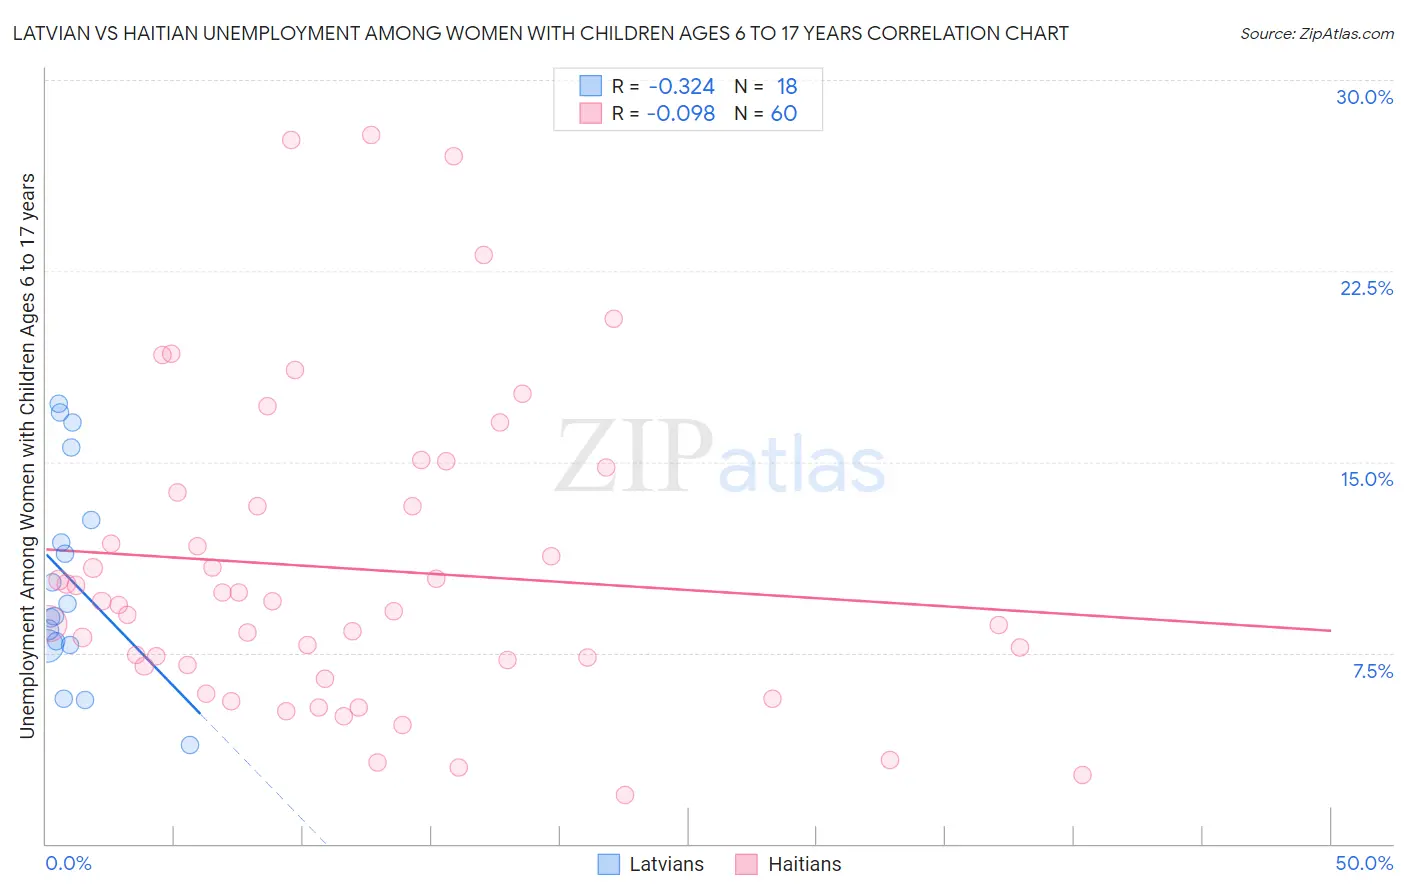
Latvian vs Haitian Unemployment Among Women with Children Ages 6 to 17 years Correlation Chart
The statistical analysis conducted on geographies consisting of 167,334,916 people shows a mild negative correlation between the proportion of Latvians and unemployment rate among women with children between the ages 6 and 17 in the United States with a correlation coefficient (R) of -0.324 and weighted average of 8.6%. Similarly, the statistical analysis conducted on geographies consisting of 222,141,030 people shows a slight negative correlation between the proportion of Haitians and unemployment rate among women with children between the ages 6 and 17 in the United States with a correlation coefficient (R) of -0.098 and weighted average of 10.0%, a difference of 16.4%.
Unemployment Among Women with Children Ages 6 to 17 years Correlation Summary
| Measurement | Latvian | Haitian |
| Minimum | 3.9% | 1.9% |
| Maximum | 17.3% | 27.8% |
| Range | 13.4% | 25.9% |
| Mean | 10.4% | 10.8% |
| Median | 9.2% | 9.4% |
| Interquartile 25% (IQ1) | 7.8% | 7.0% |
| Interquartile 75% (IQ3) | 12.7% | 13.5% |
| Interquartile Range (IQR) | 4.9% | 6.5% |
| Standard Deviation (Sample) | 4.1% | 6.1% |
| Standard Deviation (Population) | 3.9% | 6.1% |
Similar Demographics by Unemployment Among Women with Children Ages 6 to 17 years
Demographics Similar to Latvians by Unemployment Among Women with Children Ages 6 to 17 years
In terms of unemployment among women with children ages 6 to 17 years, the demographic groups most similar to Latvians are Immigrants from Romania (8.6%, a difference of 0.010%), Immigrants from Ukraine (8.6%, a difference of 0.010%), Swedish (8.6%, a difference of 0.080%), Chickasaw (8.6%, a difference of 0.090%), and Immigrants from Serbia (8.6%, a difference of 0.12%).
| Demographics | Rating | Rank | Unemployment Among Women with Children Ages 6 to 17 years |
| Scandinavians | 98.3 /100 | #103 | Exceptional 8.6% |
| Immigrants | France | 98.0 /100 | #104 | Exceptional 8.6% |
| Immigrants | Norway | 97.8 /100 | #105 | Exceptional 8.6% |
| Immigrants | Serbia | 97.7 /100 | #106 | Exceptional 8.6% |
| Chickasaw | 97.6 /100 | #107 | Exceptional 8.6% |
| Swedes | 97.6 /100 | #108 | Exceptional 8.6% |
| Immigrants | Romania | 97.5 /100 | #109 | Exceptional 8.6% |
| Latvians | 97.4 /100 | #110 | Exceptional 8.6% |
| Immigrants | Ukraine | 97.4 /100 | #111 | Exceptional 8.6% |
| Romanians | 97.1 /100 | #112 | Exceptional 8.6% |
| Eastern Europeans | 96.8 /100 | #113 | Exceptional 8.6% |
| Immigrants | Russia | 96.7 /100 | #114 | Exceptional 8.6% |
| Argentineans | 96.5 /100 | #115 | Exceptional 8.6% |
| Zimbabweans | 96.3 /100 | #116 | Exceptional 8.6% |
| Albanians | 96.3 /100 | #117 | Exceptional 8.6% |
Demographics Similar to Haitians by Unemployment Among Women with Children Ages 6 to 17 years
In terms of unemployment among women with children ages 6 to 17 years, the demographic groups most similar to Haitians are Carpatho Rusyn (10.0%, a difference of 0.090%), Ecuadorian (10.0%, a difference of 0.090%), Nonimmigrants (10.0%, a difference of 0.10%), Subsaharan African (10.0%, a difference of 0.12%), and Cherokee (10.0%, a difference of 0.13%).
| Demographics | Rating | Rank | Unemployment Among Women with Children Ages 6 to 17 years |
| Choctaw | 0.0 /100 | #286 | Tragic 9.9% |
| Sierra Leoneans | 0.0 /100 | #287 | Tragic 9.9% |
| Shoshone | 0.0 /100 | #288 | Tragic 10.0% |
| Hondurans | 0.0 /100 | #289 | Tragic 10.0% |
| Sub-Saharan Africans | 0.0 /100 | #290 | Tragic 10.0% |
| Immigrants | Nonimmigrants | 0.0 /100 | #291 | Tragic 10.0% |
| Carpatho Rusyns | 0.0 /100 | #292 | Tragic 10.0% |
| Haitians | 0.0 /100 | #293 | Tragic 10.0% |
| Ecuadorians | 0.0 /100 | #294 | Tragic 10.0% |
| Cherokee | 0.0 /100 | #295 | Tragic 10.0% |
| Immigrants | Western Africa | 0.0 /100 | #296 | Tragic 10.1% |
| Immigrants | Caribbean | 0.0 /100 | #297 | Tragic 10.1% |
| Immigrants | Haiti | 0.0 /100 | #298 | Tragic 10.1% |
| Immigrants | Honduras | 0.0 /100 | #299 | Tragic 10.1% |
| Nigerians | 0.0 /100 | #300 | Tragic 10.1% |