Immigrants from Latvia vs Haitian Unemployment Among Women with Children Ages 6 to 17 years
COMPARE
Immigrants from Latvia
Haitian
Unemployment Among Women with Children Ages 6 to 17 years
Unemployment Among Women with Children Ages 6 to 17 years Comparison
Immigrants from Latvia
Haitians
8.7%
UNEMPLOYMENT AMONG WOMEN WITH CHILDREN AGES 6 TO 17 YEARS
90.4/ 100
METRIC RATING
136th/ 347
METRIC RANK
10.0%
UNEMPLOYMENT AMONG WOMEN WITH CHILDREN AGES 6 TO 17 YEARS
0.0/ 100
METRIC RATING
293rd/ 347
METRIC RANK
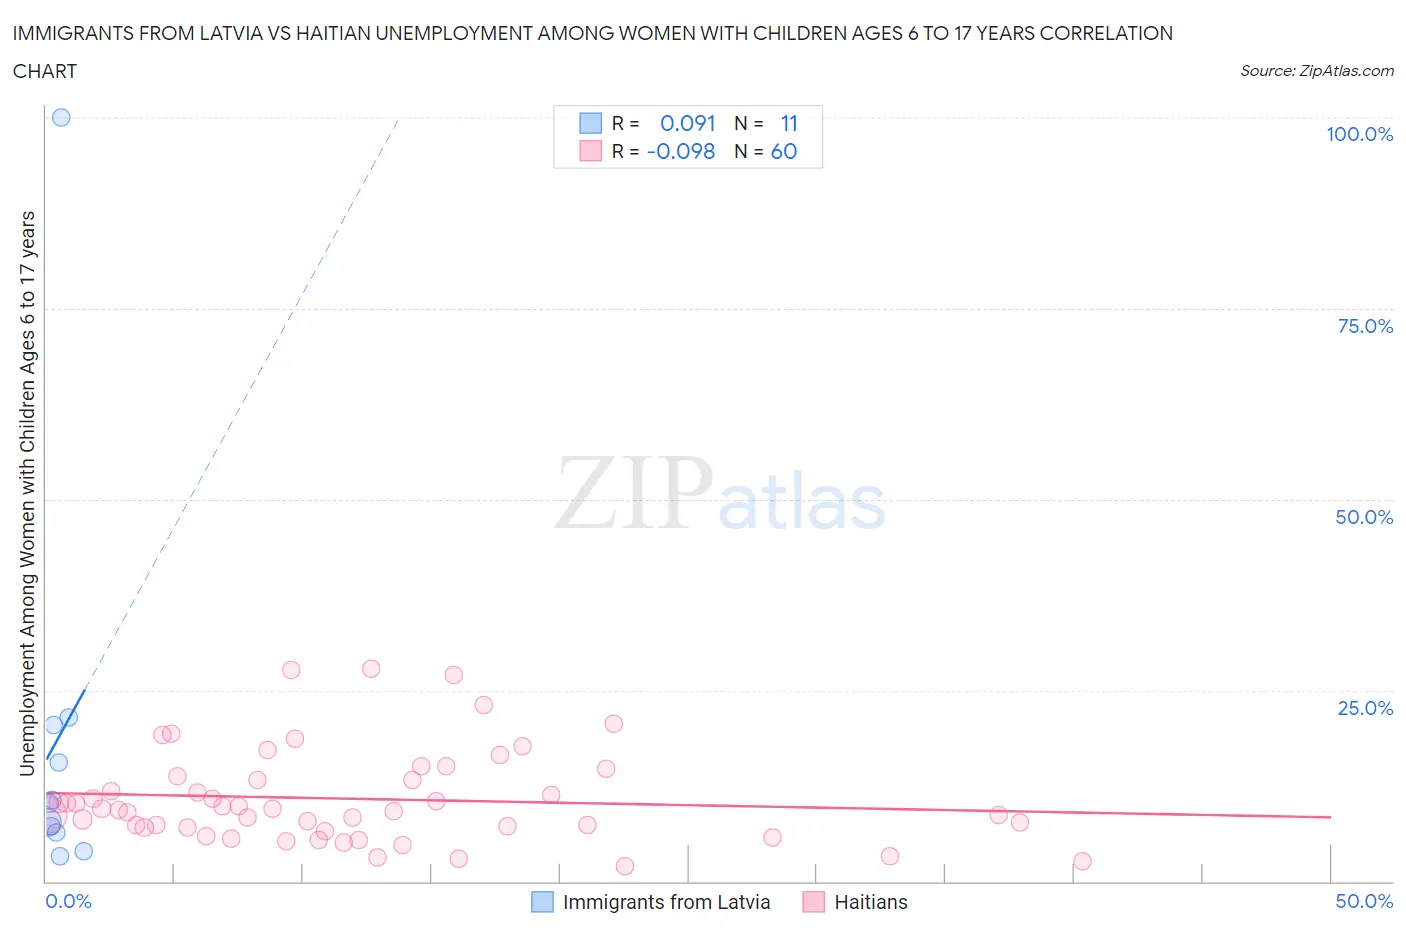
Immigrants from Latvia vs Haitian Unemployment Among Women with Children Ages 6 to 17 years Correlation Chart
The statistical analysis conducted on geographies consisting of 95,427,578 people shows a slight positive correlation between the proportion of Immigrants from Latvia and unemployment rate among women with children between the ages 6 and 17 in the United States with a correlation coefficient (R) of 0.091 and weighted average of 8.7%. Similarly, the statistical analysis conducted on geographies consisting of 222,141,030 people shows a slight negative correlation between the proportion of Haitians and unemployment rate among women with children between the ages 6 and 17 in the United States with a correlation coefficient (R) of -0.098 and weighted average of 10.0%, a difference of 14.6%.
Unemployment Among Women with Children Ages 6 to 17 years Correlation Summary
| Measurement | Immigrants from Latvia | Haitian |
| Minimum | 3.3% | 1.9% |
| Maximum | 100.0% | 27.8% |
| Range | 96.7% | 25.9% |
| Mean | 18.8% | 10.8% |
| Median | 10.2% | 9.4% |
| Interquartile 25% (IQ1) | 6.4% | 7.0% |
| Interquartile 75% (IQ3) | 20.4% | 13.5% |
| Interquartile Range (IQR) | 14.1% | 6.5% |
| Standard Deviation (Sample) | 27.6% | 6.1% |
| Standard Deviation (Population) | 26.3% | 6.1% |
Similar Demographics by Unemployment Among Women with Children Ages 6 to 17 years
Demographics Similar to Immigrants from Latvia by Unemployment Among Women with Children Ages 6 to 17 years
In terms of unemployment among women with children ages 6 to 17 years, the demographic groups most similar to Immigrants from Latvia are European (8.7%, a difference of 0.030%), Immigrants from Argentina (8.7%, a difference of 0.050%), Immigrants from Ireland (8.7%, a difference of 0.090%), Immigrants from Ethiopia (8.8%, a difference of 0.11%), and Northern European (8.8%, a difference of 0.14%).
| Demographics | Rating | Rank | Unemployment Among Women with Children Ages 6 to 17 years |
| Barbadians | 93.8 /100 | #129 | Exceptional 8.7% |
| Immigrants | Western Asia | 93.1 /100 | #130 | Exceptional 8.7% |
| Slavs | 92.2 /100 | #131 | Exceptional 8.7% |
| Yaqui | 92.2 /100 | #132 | Exceptional 8.7% |
| Egyptians | 91.8 /100 | #133 | Exceptional 8.7% |
| Immigrants | Ireland | 91.0 /100 | #134 | Exceptional 8.7% |
| Europeans | 90.6 /100 | #135 | Exceptional 8.7% |
| Immigrants | Latvia | 90.4 /100 | #136 | Exceptional 8.7% |
| Immigrants | Argentina | 90.0 /100 | #137 | Excellent 8.7% |
| Immigrants | Ethiopia | 89.5 /100 | #138 | Excellent 8.8% |
| Northern Europeans | 89.2 /100 | #139 | Excellent 8.8% |
| Immigrants | Poland | 88.3 /100 | #140 | Excellent 8.8% |
| Serbians | 87.6 /100 | #141 | Excellent 8.8% |
| Immigrants | Austria | 87.5 /100 | #142 | Excellent 8.8% |
| Immigrants | Kenya | 86.1 /100 | #143 | Excellent 8.8% |
Demographics Similar to Haitians by Unemployment Among Women with Children Ages 6 to 17 years
In terms of unemployment among women with children ages 6 to 17 years, the demographic groups most similar to Haitians are Carpatho Rusyn (10.0%, a difference of 0.090%), Ecuadorian (10.0%, a difference of 0.090%), Nonimmigrants (10.0%, a difference of 0.10%), Subsaharan African (10.0%, a difference of 0.12%), and Cherokee (10.0%, a difference of 0.13%).
| Demographics | Rating | Rank | Unemployment Among Women with Children Ages 6 to 17 years |
| Choctaw | 0.0 /100 | #286 | Tragic 9.9% |
| Sierra Leoneans | 0.0 /100 | #287 | Tragic 9.9% |
| Shoshone | 0.0 /100 | #288 | Tragic 10.0% |
| Hondurans | 0.0 /100 | #289 | Tragic 10.0% |
| Sub-Saharan Africans | 0.0 /100 | #290 | Tragic 10.0% |
| Immigrants | Nonimmigrants | 0.0 /100 | #291 | Tragic 10.0% |
| Carpatho Rusyns | 0.0 /100 | #292 | Tragic 10.0% |
| Haitians | 0.0 /100 | #293 | Tragic 10.0% |
| Ecuadorians | 0.0 /100 | #294 | Tragic 10.0% |
| Cherokee | 0.0 /100 | #295 | Tragic 10.0% |
| Immigrants | Western Africa | 0.0 /100 | #296 | Tragic 10.1% |
| Immigrants | Caribbean | 0.0 /100 | #297 | Tragic 10.1% |
| Immigrants | Haiti | 0.0 /100 | #298 | Tragic 10.1% |
| Immigrants | Honduras | 0.0 /100 | #299 | Tragic 10.1% |
| Nigerians | 0.0 /100 | #300 | Tragic 10.1% |