Swedish vs Immigrants from Zimbabwe Unemployment
COMPARE
Swedish
Immigrants from Zimbabwe
Unemployment
Unemployment Comparison
Swedes
Immigrants from Zimbabwe
4.4%
UNEMPLOYMENT
100.0/ 100
METRIC RATING
5th/ 347
METRIC RANK
4.9%
UNEMPLOYMENT
99.2/ 100
METRIC RATING
53rd/ 347
METRIC RANK
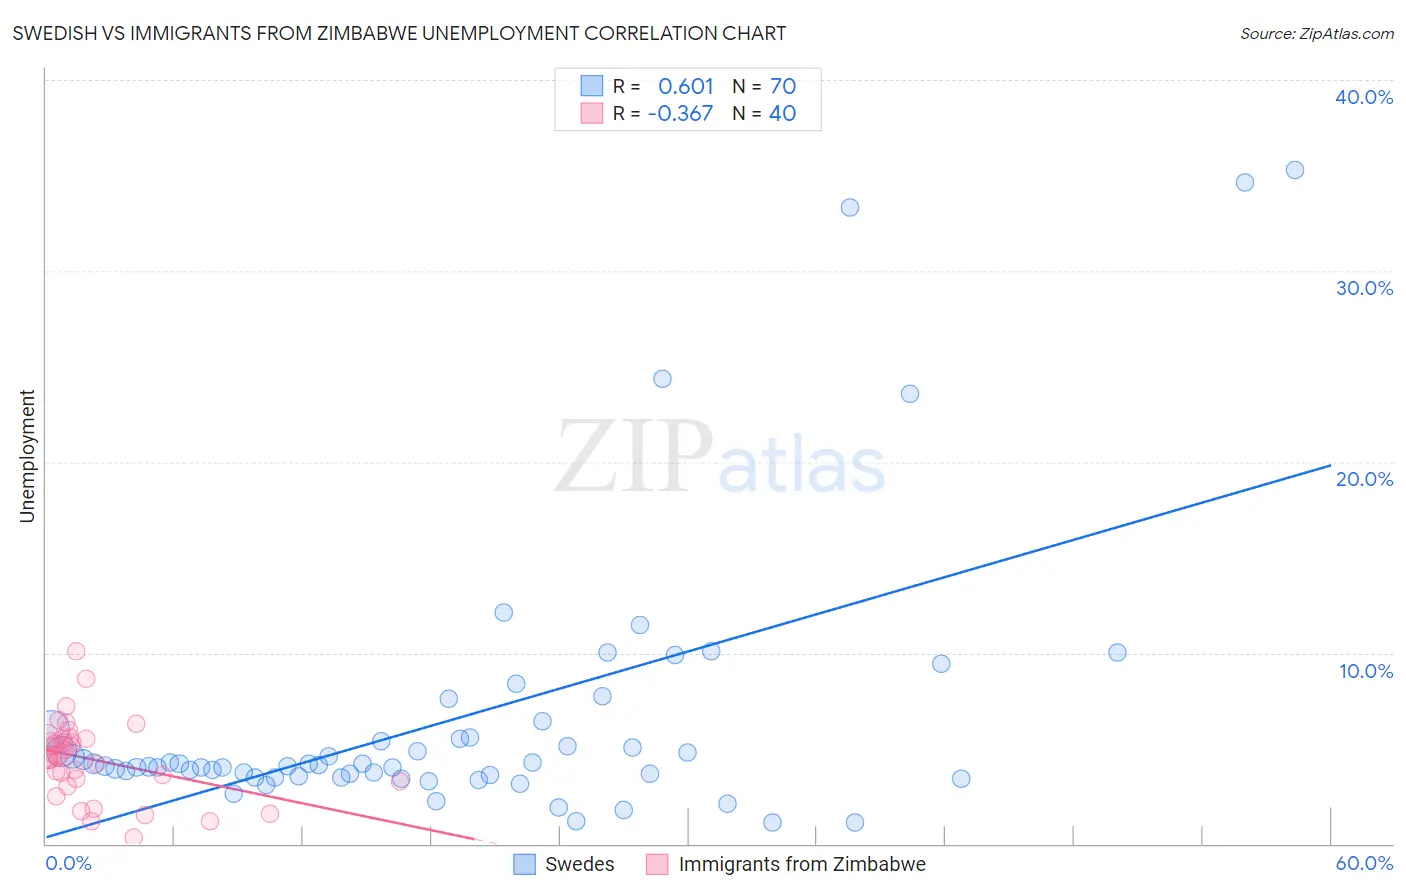
Swedish vs Immigrants from Zimbabwe Unemployment Correlation Chart
The statistical analysis conducted on geographies consisting of 536,260,652 people shows a significant positive correlation between the proportion of Swedes and unemployment in the United States with a correlation coefficient (R) of 0.601 and weighted average of 4.4%. Similarly, the statistical analysis conducted on geographies consisting of 117,788,083 people shows a mild negative correlation between the proportion of Immigrants from Zimbabwe and unemployment in the United States with a correlation coefficient (R) of -0.367 and weighted average of 4.9%, a difference of 9.4%.
Unemployment Correlation Summary
| Measurement | Swedish | Immigrants from Zimbabwe |
| Minimum | 1.1% | 0.30% |
| Maximum | 35.3% | 10.1% |
| Range | 34.2% | 9.8% |
| Mean | 6.5% | 4.4% |
| Median | 4.1% | 4.6% |
| Interquartile 25% (IQ1) | 3.5% | 3.4% |
| Interquartile 75% (IQ3) | 5.6% | 5.5% |
| Interquartile Range (IQR) | 2.0% | 2.1% |
| Standard Deviation (Sample) | 7.2% | 2.0% |
| Standard Deviation (Population) | 7.1% | 2.0% |
Similar Demographics by Unemployment
Demographics Similar to Swedes by Unemployment
In terms of unemployment, the demographic groups most similar to Swedes are German (4.5%, a difference of 0.79%), Immigrants from India (4.5%, a difference of 1.3%), Swiss (4.5%, a difference of 1.8%), Scandinavian (4.5%, a difference of 2.2%), and Danish (4.3%, a difference of 2.3%).
| Demographics | Rating | Rank | Unemployment |
| Norwegians | 100.0 /100 | #1 | Exceptional 4.2% |
| Luxembourgers | 100.0 /100 | #2 | Exceptional 4.3% |
| Czechs | 100.0 /100 | #3 | Exceptional 4.3% |
| Danes | 100.0 /100 | #4 | Exceptional 4.3% |
| Swedes | 100.0 /100 | #5 | Exceptional 4.4% |
| Germans | 100.0 /100 | #6 | Exceptional 4.5% |
| Immigrants | India | 100.0 /100 | #7 | Exceptional 4.5% |
| Swiss | 100.0 /100 | #8 | Exceptional 4.5% |
| Scandinavians | 100.0 /100 | #9 | Exceptional 4.5% |
| Dutch | 100.0 /100 | #10 | Exceptional 4.6% |
| English | 100.0 /100 | #11 | Exceptional 4.6% |
| Pennsylvania Germans | 100.0 /100 | #12 | Exceptional 4.6% |
| Belgians | 100.0 /100 | #13 | Exceptional 4.6% |
| Immigrants | Cuba | 100.0 /100 | #14 | Exceptional 4.6% |
| Europeans | 99.9 /100 | #15 | Exceptional 4.6% |
Demographics Similar to Immigrants from Zimbabwe by Unemployment
In terms of unemployment, the demographic groups most similar to Immigrants from Zimbabwe are White/Caucasian (4.9%, a difference of 0.030%), Eastern European (4.9%, a difference of 0.030%), Immigrants from Belgium (4.9%, a difference of 0.040%), Australian (4.9%, a difference of 0.060%), and French Canadian (4.9%, a difference of 0.20%).
| Demographics | Rating | Rank | Unemployment |
| Immigrants | Nepal | 99.4 /100 | #46 | Exceptional 4.8% |
| Immigrants | Taiwan | 99.4 /100 | #47 | Exceptional 4.8% |
| Immigrants | Scotland | 99.3 /100 | #48 | Exceptional 4.9% |
| Immigrants | South Central Asia | 99.3 /100 | #49 | Exceptional 4.9% |
| French Canadians | 99.3 /100 | #50 | Exceptional 4.9% |
| Immigrants | Belgium | 99.2 /100 | #51 | Exceptional 4.9% |
| Whites/Caucasians | 99.2 /100 | #52 | Exceptional 4.9% |
| Immigrants | Zimbabwe | 99.2 /100 | #53 | Exceptional 4.9% |
| Eastern Europeans | 99.2 /100 | #54 | Exceptional 4.9% |
| Australians | 99.2 /100 | #55 | Exceptional 4.9% |
| Celtics | 99.1 /100 | #56 | Exceptional 4.9% |
| Immigrants | Singapore | 99.1 /100 | #57 | Exceptional 4.9% |
| Greeks | 99.0 /100 | #58 | Exceptional 4.9% |
| Bhutanese | 99.0 /100 | #59 | Exceptional 4.9% |
| Immigrants | Netherlands | 99.0 /100 | #60 | Exceptional 4.9% |