Inupiat vs Immigrants from Zimbabwe Unemployment
COMPARE
Inupiat
Immigrants from Zimbabwe
Unemployment
Unemployment Comparison
Inupiat
Immigrants from Zimbabwe
10.1%
UNEMPLOYMENT
0.0/ 100
METRIC RATING
345th/ 347
METRIC RANK
4.9%
UNEMPLOYMENT
99.2/ 100
METRIC RATING
53rd/ 347
METRIC RANK
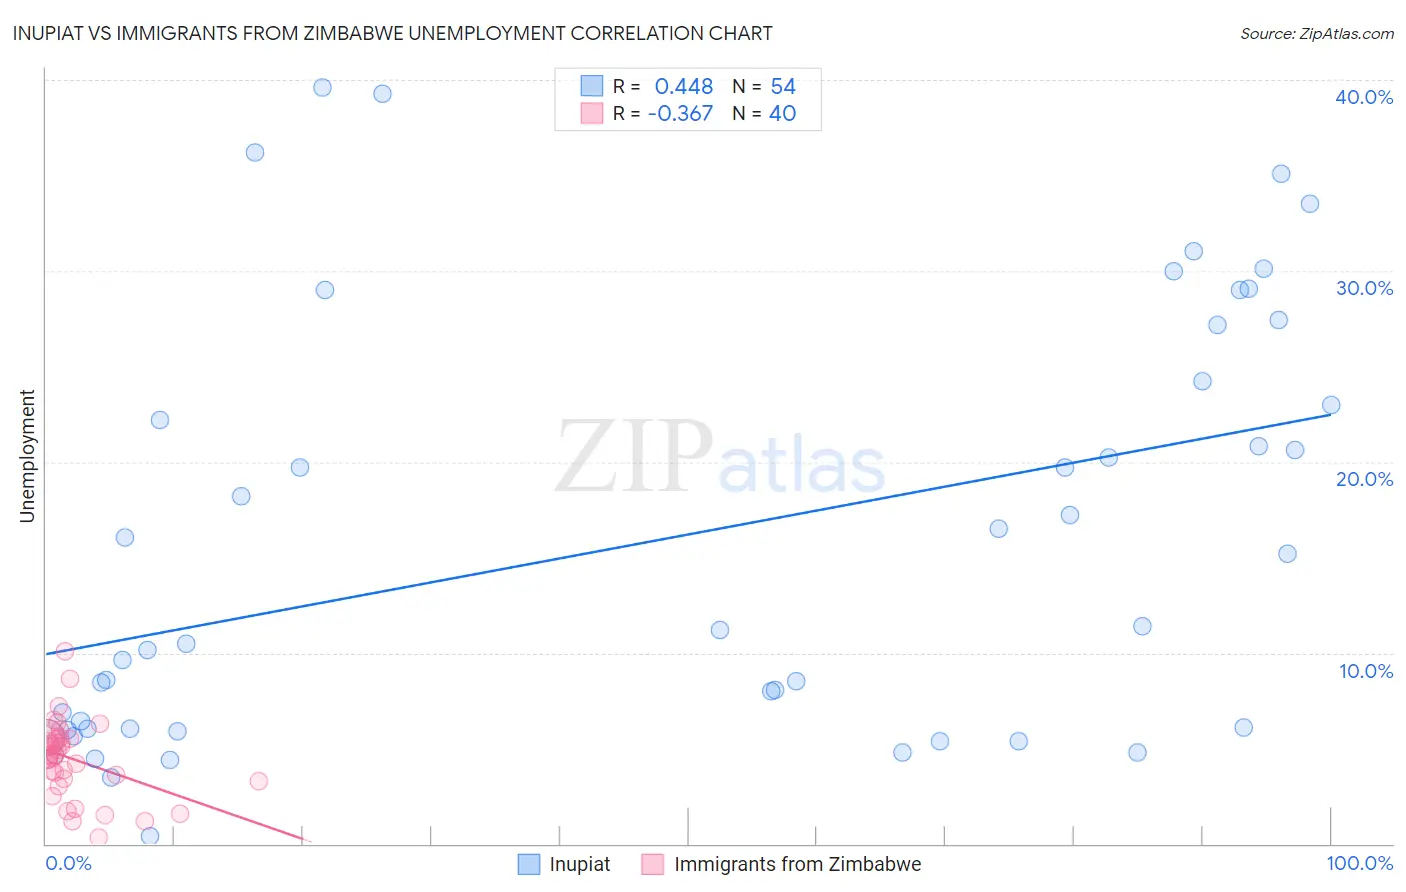
Inupiat vs Immigrants from Zimbabwe Unemployment Correlation Chart
The statistical analysis conducted on geographies consisting of 96,296,891 people shows a moderate positive correlation between the proportion of Inupiat and unemployment in the United States with a correlation coefficient (R) of 0.448 and weighted average of 10.1%. Similarly, the statistical analysis conducted on geographies consisting of 117,788,083 people shows a mild negative correlation between the proportion of Immigrants from Zimbabwe and unemployment in the United States with a correlation coefficient (R) of -0.367 and weighted average of 4.9%, a difference of 107.7%.
Unemployment Correlation Summary
| Measurement | Inupiat | Immigrants from Zimbabwe |
| Minimum | 0.40% | 0.30% |
| Maximum | 39.6% | 10.1% |
| Range | 39.2% | 9.8% |
| Mean | 15.9% | 4.4% |
| Median | 11.3% | 4.6% |
| Interquartile 25% (IQ1) | 6.0% | 3.4% |
| Interquartile 75% (IQ3) | 24.2% | 5.5% |
| Interquartile Range (IQR) | 18.2% | 2.1% |
| Standard Deviation (Sample) | 11.0% | 2.0% |
| Standard Deviation (Population) | 10.9% | 2.0% |
Similar Demographics by Unemployment
Demographics Similar to Inupiat by Unemployment
In terms of unemployment, the demographic groups most similar to Inupiat are Arapaho (9.8%, a difference of 2.9%), Crow (11.1%, a difference of 9.4%), Yuman (9.1%, a difference of 11.6%), Hopi (8.9%, a difference of 13.5%), and Tohono O'odham (8.9%, a difference of 14.0%).
| Demographics | Rating | Rank | Unemployment |
| Immigrants | Dominican Republic | 0.0 /100 | #333 | Tragic 7.4% |
| Apache | 0.0 /100 | #334 | Tragic 7.4% |
| Alaskan Athabascans | 0.0 /100 | #335 | Tragic 7.7% |
| Immigrants | Yemen | 0.0 /100 | #336 | Tragic 7.7% |
| Cheyenne | 0.0 /100 | #337 | Tragic 8.0% |
| Pima | 0.0 /100 | #338 | Tragic 8.2% |
| Navajo | 0.0 /100 | #339 | Tragic 8.4% |
| Puerto Ricans | 0.0 /100 | #340 | Tragic 8.4% |
| Tohono O'odham | 0.0 /100 | #341 | Tragic 8.9% |
| Hopi | 0.0 /100 | #342 | Tragic 8.9% |
| Yuman | 0.0 /100 | #343 | Tragic 9.1% |
| Arapaho | 0.0 /100 | #344 | Tragic 9.8% |
| Inupiat | 0.0 /100 | #345 | Tragic 10.1% |
| Crow | 0.0 /100 | #346 | Tragic 11.1% |
| Yup'ik | 0.0 /100 | #347 | Tragic 13.6% |
Demographics Similar to Immigrants from Zimbabwe by Unemployment
In terms of unemployment, the demographic groups most similar to Immigrants from Zimbabwe are White/Caucasian (4.9%, a difference of 0.030%), Eastern European (4.9%, a difference of 0.030%), Immigrants from Belgium (4.9%, a difference of 0.040%), Australian (4.9%, a difference of 0.060%), and French Canadian (4.9%, a difference of 0.20%).
| Demographics | Rating | Rank | Unemployment |
| Immigrants | Nepal | 99.4 /100 | #46 | Exceptional 4.8% |
| Immigrants | Taiwan | 99.4 /100 | #47 | Exceptional 4.8% |
| Immigrants | Scotland | 99.3 /100 | #48 | Exceptional 4.9% |
| Immigrants | South Central Asia | 99.3 /100 | #49 | Exceptional 4.9% |
| French Canadians | 99.3 /100 | #50 | Exceptional 4.9% |
| Immigrants | Belgium | 99.2 /100 | #51 | Exceptional 4.9% |
| Whites/Caucasians | 99.2 /100 | #52 | Exceptional 4.9% |
| Immigrants | Zimbabwe | 99.2 /100 | #53 | Exceptional 4.9% |
| Eastern Europeans | 99.2 /100 | #54 | Exceptional 4.9% |
| Australians | 99.2 /100 | #55 | Exceptional 4.9% |
| Celtics | 99.1 /100 | #56 | Exceptional 4.9% |
| Immigrants | Singapore | 99.1 /100 | #57 | Exceptional 4.9% |
| Greeks | 99.0 /100 | #58 | Exceptional 4.9% |
| Bhutanese | 99.0 /100 | #59 | Exceptional 4.9% |
| Immigrants | Netherlands | 99.0 /100 | #60 | Exceptional 4.9% |