Immigrants from Iraq vs Immigrants from Zimbabwe Unemployment
COMPARE
Immigrants from Iraq
Immigrants from Zimbabwe
Unemployment
Unemployment Comparison
Immigrants from Iraq
Immigrants from Zimbabwe
5.4%
UNEMPLOYMENT
18.6/ 100
METRIC RATING
210th/ 347
METRIC RANK
4.9%
UNEMPLOYMENT
99.2/ 100
METRIC RATING
53rd/ 347
METRIC RANK
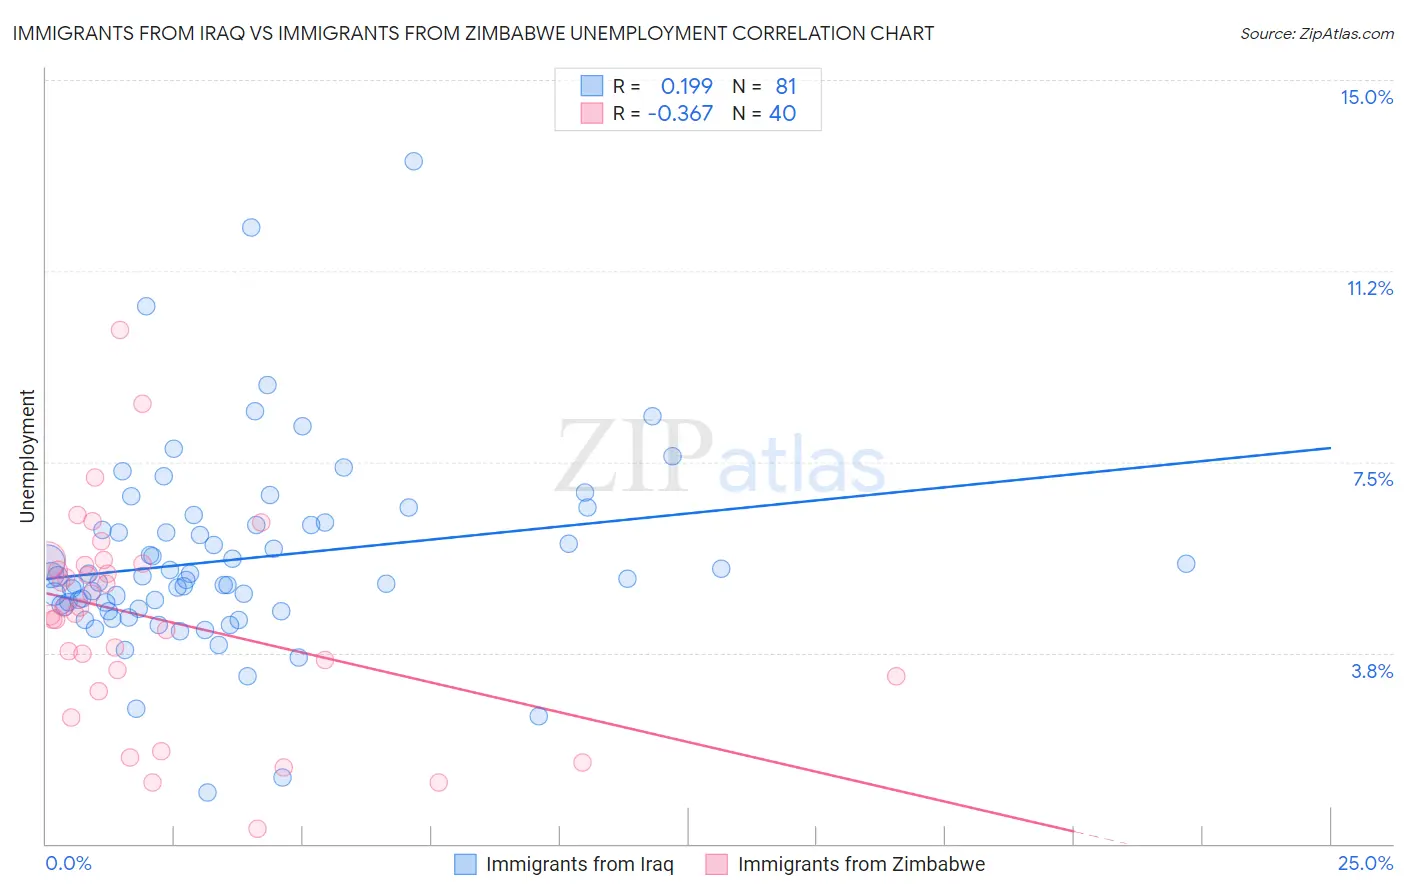
Immigrants from Iraq vs Immigrants from Zimbabwe Unemployment Correlation Chart
The statistical analysis conducted on geographies consisting of 194,739,178 people shows a poor positive correlation between the proportion of Immigrants from Iraq and unemployment in the United States with a correlation coefficient (R) of 0.199 and weighted average of 5.4%. Similarly, the statistical analysis conducted on geographies consisting of 117,788,083 people shows a mild negative correlation between the proportion of Immigrants from Zimbabwe and unemployment in the United States with a correlation coefficient (R) of -0.367 and weighted average of 4.9%, a difference of 10.5%.
Unemployment Correlation Summary
| Measurement | Immigrants from Iraq | Immigrants from Zimbabwe |
| Minimum | 1.0% | 0.30% |
| Maximum | 13.4% | 10.1% |
| Range | 12.4% | 9.8% |
| Mean | 5.6% | 4.4% |
| Median | 5.2% | 4.6% |
| Interquartile 25% (IQ1) | 4.6% | 3.4% |
| Interquartile 75% (IQ3) | 6.3% | 5.5% |
| Interquartile Range (IQR) | 1.6% | 2.1% |
| Standard Deviation (Sample) | 1.9% | 2.0% |
| Standard Deviation (Population) | 1.9% | 2.0% |
Similar Demographics by Unemployment
Demographics Similar to Immigrants from Iraq by Unemployment
In terms of unemployment, the demographic groups most similar to Immigrants from Iraq are Immigrants from Iran (5.4%, a difference of 0.020%), Portuguese (5.4%, a difference of 0.050%), Iraqi (5.4%, a difference of 0.050%), Ugandan (5.4%, a difference of 0.060%), and Creek (5.4%, a difference of 0.080%).
| Demographics | Rating | Rank | Unemployment |
| Immigrants | Micronesia | 25.2 /100 | #203 | Fair 5.3% |
| Immigrants | Ukraine | 24.9 /100 | #204 | Fair 5.3% |
| Native Hawaiians | 24.1 /100 | #205 | Fair 5.3% |
| Immigrants | Peru | 22.7 /100 | #206 | Fair 5.4% |
| Creek | 19.4 /100 | #207 | Poor 5.4% |
| Portuguese | 19.0 /100 | #208 | Poor 5.4% |
| Immigrants | Iran | 18.8 /100 | #209 | Poor 5.4% |
| Immigrants | Iraq | 18.6 /100 | #210 | Poor 5.4% |
| Iraqis | 18.1 /100 | #211 | Poor 5.4% |
| Ugandans | 18.0 /100 | #212 | Poor 5.4% |
| Immigrants | Middle Africa | 15.3 /100 | #213 | Poor 5.4% |
| Immigrants | Costa Rica | 15.2 /100 | #214 | Poor 5.4% |
| Delaware | 14.7 /100 | #215 | Poor 5.4% |
| Immigrants | South America | 13.5 /100 | #216 | Poor 5.4% |
| Immigrants | Albania | 13.5 /100 | #217 | Poor 5.4% |
Demographics Similar to Immigrants from Zimbabwe by Unemployment
In terms of unemployment, the demographic groups most similar to Immigrants from Zimbabwe are White/Caucasian (4.9%, a difference of 0.030%), Eastern European (4.9%, a difference of 0.030%), Immigrants from Belgium (4.9%, a difference of 0.040%), Australian (4.9%, a difference of 0.060%), and French Canadian (4.9%, a difference of 0.20%).
| Demographics | Rating | Rank | Unemployment |
| Immigrants | Nepal | 99.4 /100 | #46 | Exceptional 4.8% |
| Immigrants | Taiwan | 99.4 /100 | #47 | Exceptional 4.8% |
| Immigrants | Scotland | 99.3 /100 | #48 | Exceptional 4.9% |
| Immigrants | South Central Asia | 99.3 /100 | #49 | Exceptional 4.9% |
| French Canadians | 99.3 /100 | #50 | Exceptional 4.9% |
| Immigrants | Belgium | 99.2 /100 | #51 | Exceptional 4.9% |
| Whites/Caucasians | 99.2 /100 | #52 | Exceptional 4.9% |
| Immigrants | Zimbabwe | 99.2 /100 | #53 | Exceptional 4.9% |
| Eastern Europeans | 99.2 /100 | #54 | Exceptional 4.9% |
| Australians | 99.2 /100 | #55 | Exceptional 4.9% |
| Celtics | 99.1 /100 | #56 | Exceptional 4.9% |
| Immigrants | Singapore | 99.1 /100 | #57 | Exceptional 4.9% |
| Greeks | 99.0 /100 | #58 | Exceptional 4.9% |
| Bhutanese | 99.0 /100 | #59 | Exceptional 4.9% |
| Immigrants | Netherlands | 99.0 /100 | #60 | Exceptional 4.9% |